
Are You a USGS Water Data User?
USGS Water Data products have many users. Are you one of our users? This post breaks down who uses USGS Water products and what data is available about those users.
A kayaker rises before dawn. A parent prepares their children for a drive into town over a ferocious river. A utility worker loads her truck to perform repairs on a downed power line. A fisherman loads their boat with gear for a long day. A retiree stares up at a darkening sky as a storm approaches. One of these users might remind you of yourself! What do they all have in common? They are all users of USGS Water Data for the Nation products, and the next thing they will do is head to our products to get water information essential to their decision making.
Our team communicates a lot about user research and delivering user-oriented products, but what do we really know about you, our user? Let’s dive into what we know and what we’re still learning.
We have lots of users
We can tell how many people use our products by looking at combined analytics for both our Legacy and Next Generation pages. From October 2022 - September 2023, we had
- 31 million unique visits by user
- 57 million pageviews
- 9.9 million new users
Once people find our pages, they come back again. We like that you like us. The average user visits our webpages about 3.2 times a year.
Each person who uses our products is unique, so the frequency of their interactions with our products varies. That means those users on average are interacting with us at least multiple times per week, if not every day.
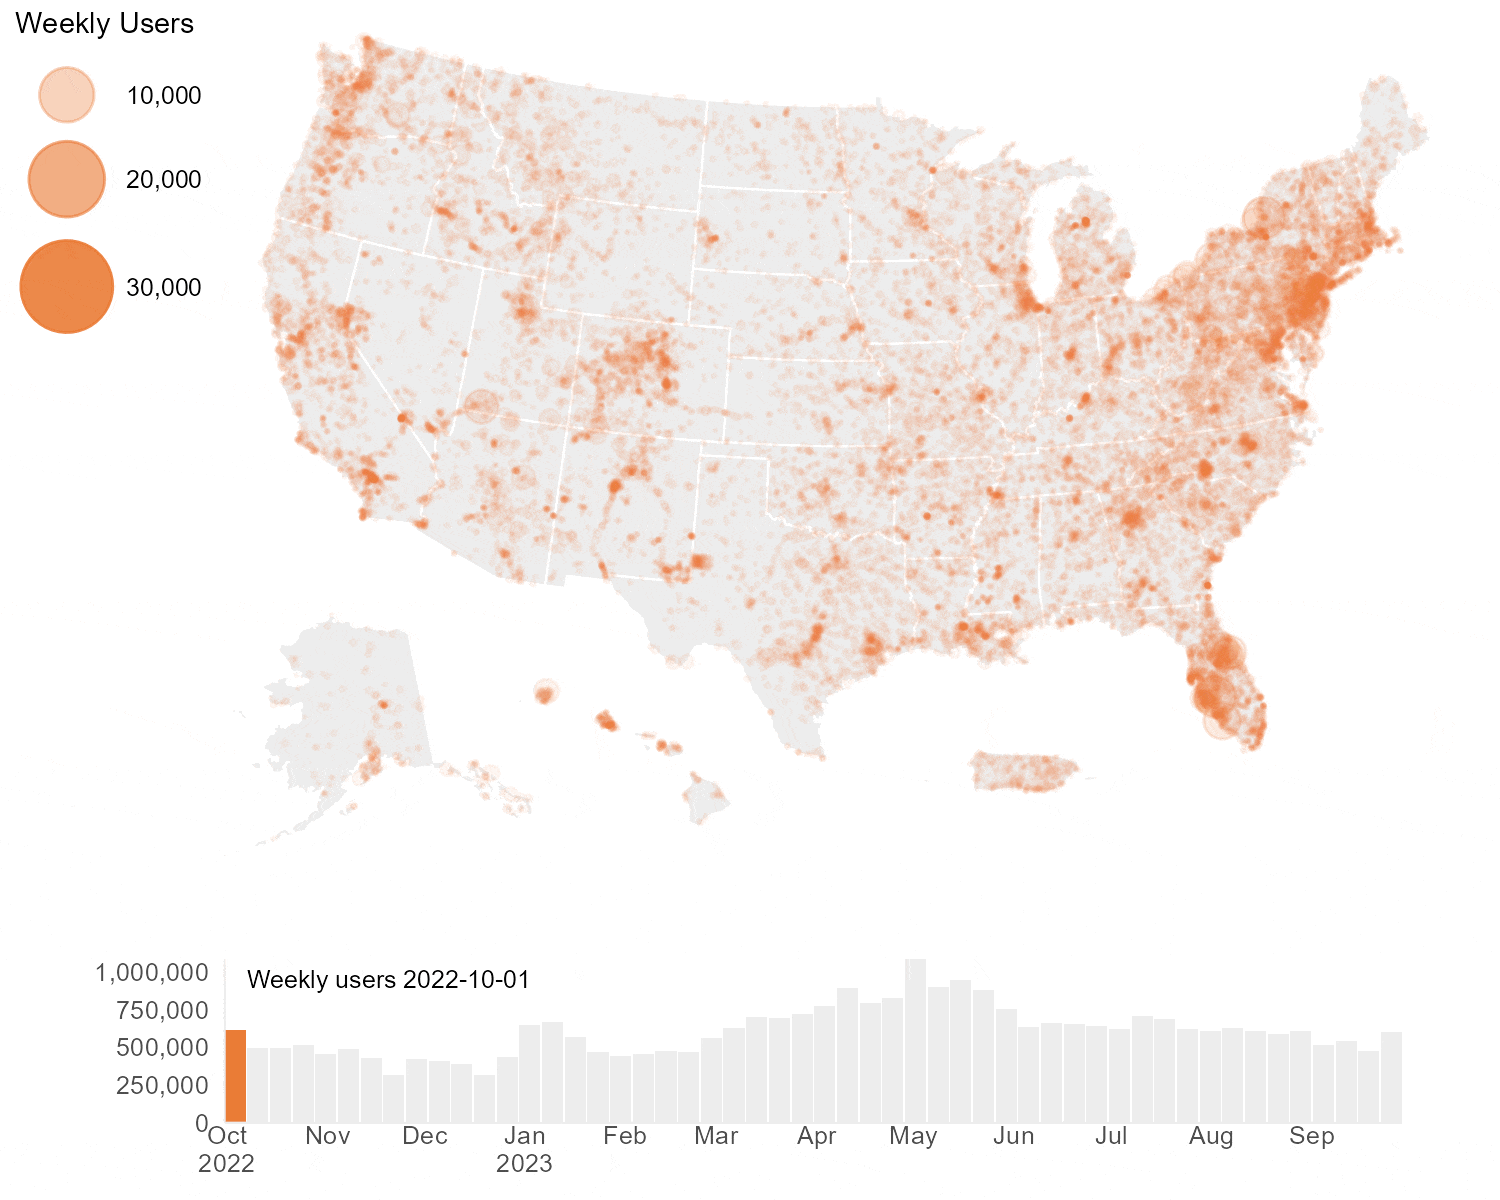
An animation of the number of users per gage site from October 1, 2022 to September 30, 2023.
Thousands of users also rely on USGS’s Water Services. These tools allow people to query our data uniquely, often in an automated way. We track these users and the data that they download in logs so we can consider their needs as we develop new software.
Our users are from all over the world
Although we primarily serve water data from the United States and associated territories, our webpages are visited by people from all over the world. Most of our users are from the United States, with the number of users varying by state. Figure 2 shows the number of users by state, with California showing the largest number of users from October 2022 to September 2023.
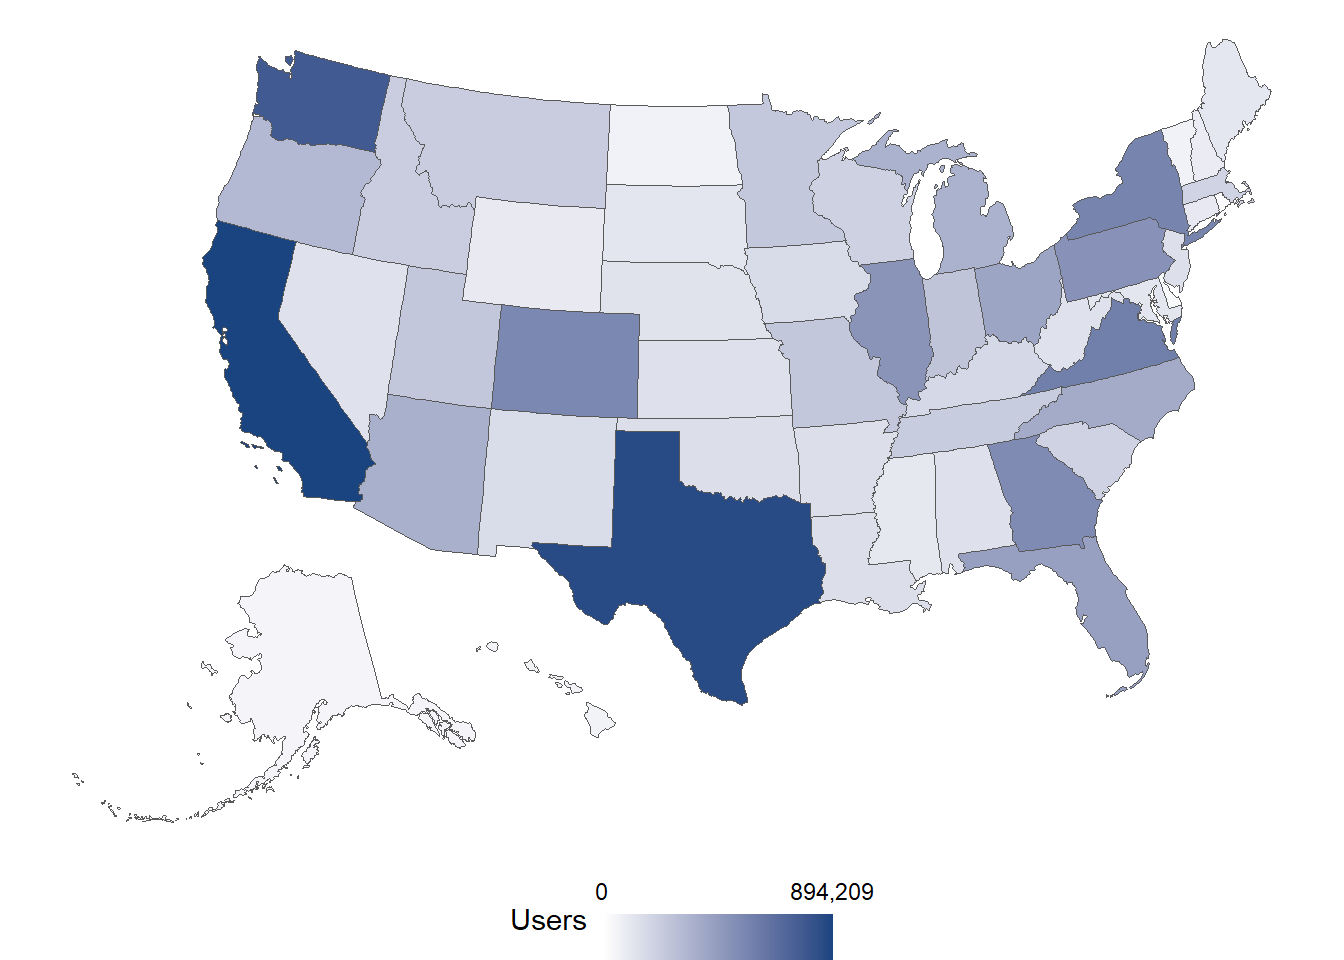
Figure 2. A map of the distribution of our users in Fiscal Year 2023
Users trust us
Our users trust USGS to deliver highly accurate data, looking to the USGS as a leader in earth science data delivery. USGS data are incorporated into countless programs and models that need the high level of accuracy and precision that we offer. Someone who uses monitoring location pages because they live in a floodplain says, “USGS is really accurate. I really like it.” Another user who uses monitoring location pages for recreational fishing in the Mississippi Gulf says, "I’m very confident that what I’m seeing is what it actually is. It is so seldom that the data is off. At my former job, we said we had 99.99% reliability and USGS accuracy is much better than that." At USGS, accuracy of our data is of utmost importance - it’s one of our core values as scientists. Our field and laboratory protocols ensure that we deliver high-quality data.
The real-time delivery of our data allows users to integrate USGS data into decision-making activities. Sometimes this results in decision makers using USGS data in times of emergency, such as during floods and droughts. Other times, our data can be used to monitor important systems. For example, a 2021 news article highlighted how our real-time monitoring data helped save the lives of thousands of fish when streamflow dropped to a dangerous level.
How do we know who our users are?
How do we know you? We shape our understanding of our user base by compiling information using several methods.
Web analytics
We rely on analytics to understand broader questions about our users. This aggregated information allows us to answer quantitative questions, like how many users visit our websites or how long people spend using our products. We can also use analytics to dive into what type of devices people use and how they navigate between pages on our website. Web analytics also provides focus for our user research, as we try to understand the motivations or thoughts behind an action.
Analytics tell us what users do while our user research helps us understand why they do what they do.
User research
We think about our users all the time. Early in our design process, we discover how to build our products by asking you, the user, to explore product prototypes during one-on-one calls.
As we build our products, we test the products’ usability by asking users to interact with them while we observe. We often start with our own USGS Water Mission Area employees. Our internal colleagues often access technology that’s in development on our internal network, providing feedback using their professional perspective. After that, it’s important we test with a wide variety of users to understand different perspectives and use cases. We reach out to those people who we expect to use our products, such as state agency cooperators, academic researchers, and members of the general public – you!
During testing, we first ask users to tell us about their background and role, and why they are using the product. We want to learn more about you! Then we listen as users explain their thought process while they navigate through our products. We ask our users to complete specific tasks, such as downloading data or answering questions about what the data is telling them.
User research is never done. We regularly evaluate our existing products to make sure they continue to support user needs. If you’d be interested in participating in our user research process, please email WDFN@usgs.gov with the subject ‘User Research’ and we will add you to our user roster!
Real user feedback & engagement
Communicating with real people is the best way for us to understand who you are, what you want, and how you navigate through our products. Users contact us via email through the Help Desk or the feedback link on webpages. As a team, we respond to each email. In addition to directly addressing each user’s request or comment, we also share existing blog posts, user testing opportunities, and other ways to stay connected.
We also periodically hold webinars. During our webinars, we often dedicate about half the time to live questions from the audience. We also offer audience members the opportunity to participate in live polling. We love connecting with our users over social media because it can be so interactive – connect with us on Instagram and Twitter and subscribe to our newsletter .
How do we organize our users?
With so many different users, how do we group you to consider your diverse needs? Historically, we grouped users by professional title such as Hydrographer or Water Manager. However, we’ve learned more about our users and we modified that approach to better meet user needs.
We use a simple organization based on a user’s workflow. The main factors that go into a user’s workflow are
- the amount of data needed
- the amount of supporting information for the data (also referred to as metadata)
- the frequency of needing data
Based on these workflow needs, four user groups emerged:
Operationalized Pull : These users pull data from multiple sources, including USGS API services, to use via custom dashboards and tools optimized for their location and needs. Operationalized Pull users, on average, use the most USGS water information, returning repeatedly for refreshed data to pull into their own systems.
Explore & Download : These users find nearby sites, exploring what data they collect. Users make ad-hoc or targeted queries to download, then alter the data as they need in their preferred tool (R, Excel, Python). Explore and Download users usually take their time exploring the data visually (maps, hydrographs, etc.) before finally downloading the data they find useful.
Check Status : These users perform routine checks of a few parameters for specific sites, primarily using the hydrographs. Check Status users are our largest user type by number of unique users. Each user generally looks at a handful of sites for the latest water conditions.
Advanced Check Status : These users perform routine checks of a few data types at more than one monitoring location at a time, primarily using hydrographs of multiple monitoring locations, either as a single graph or a scrollable page. They desire “at-a-glance” information that is more information-dense than the Check Status user needs.
With these user groups, we can more accurately describe an ideal user journey through our site by knowing which products you might find inspiring to use and what you goal is on our site.
What if I don’t fall into just one user group?
Sometimes users fall into more than one user group based on their needs. People with professional titles or technical skills can find themselves in one or more categories depending on their current task. Similarly, you might visit our website for many different reasons that span the user groups such as to check levels surrounding a flood event or to conduct research for a project.
#EnGageWithUSGS
Connect with us! Follow us on Twitter and Instagram . When you engage with us, we learn from you how you currently use our data. Developing these relationships with our users helps us identify which user group(s) you might relate to. While these four user groups have helped us focus on designing around a user’s workflow, sometimes we need to consider other important factors as well. We check in with users to understand your familiarity with a scientific concept or the urgency with which you need data. We’d love to hear your perspective on our data and ensure we’re meeting your needs. Please contact us at wdfn@usgs.gov .
Subscribe to the new Water Data for the Nation newsletter to stay up to date with our product offerings, events, and other ways to connect with us.
Quotes in this blog post have been lightly edited for grammar and clarity only.
Related Posts
Check Status Users
December 29, 2021
Here at WDFN, we employ user-centered design to build better products and reduce risk. This blog is one of a five-part series on users of WDFN: Are You a USGS Water Data User? | Water Data For The Nation Blog .
Explore & Download Users
December 29, 2021
Here at WDFN, we employ user-centered design to build better products and reduce risk. This blog is one of a five-part series on users of WDFN: Are You a USGS Water Data User? | Water Data For The Nation Blog .
Operationalized Pull Users
December 29, 2021
Here at WDFN, we employ user-centered design to build better products and reduce risk. This blog is one of a five-part series on users of WDFN: Are You a USGS Water Data User? | Water Data For The Nation Blog .
User-Centered Design - WDFN Multi-Location Functionality
August 18, 2025
User-centered design is a process where we focus our designs based on the context and the needs of our users. We involve users throughout our agile and user-centered development process. The core principles of user-centered design are to learn about the users, build for their needs, and refine your designs based on their feedback.
This blog post focuses on how we used the core principles of user-centered design to modernize the Water Data for the Nation (WDFN) multi-location functionality. Learn more about user-centered design in our previous blog.Advanced Check Status Users
May 19, 2024
Here at WDFN, we employ user-centered design to build better products and reduce risk. This blog is one of a five-part series on users of WDFN: Are You a USGS Water Data User? | Water Data For The Nation Blog .