
Plotting hydrography data has never been easier with the latest versions of nhdplusTools and ggplot2. This blog demonstrates how to fetch and map National Hydrography Dataset (NHD) rivers and waterbodies with several reproducible examples.
Official websites use .gov
A .gov website belongs to an official government organization in the
United States.
Secure .gov websites use HTTPS
A lock (
) or https:// means you’ve safely connected to the .gov website. Share
sensitive information only on official, secure websites.
Plotting hydrography data has never been easier with the latest versions of nhdplusTools and ggplot2. This blog demonstrates how to fetch and map National Hydrography Dataset (NHD) rivers and waterbodies with several reproducible examples.
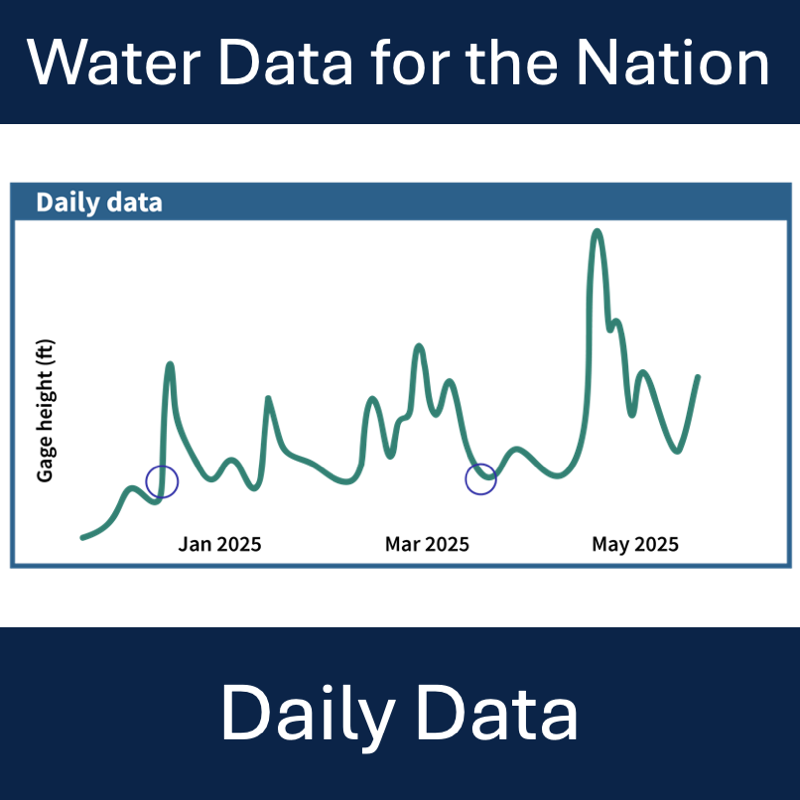
Where to find and download daily data in Water Data for the Nation
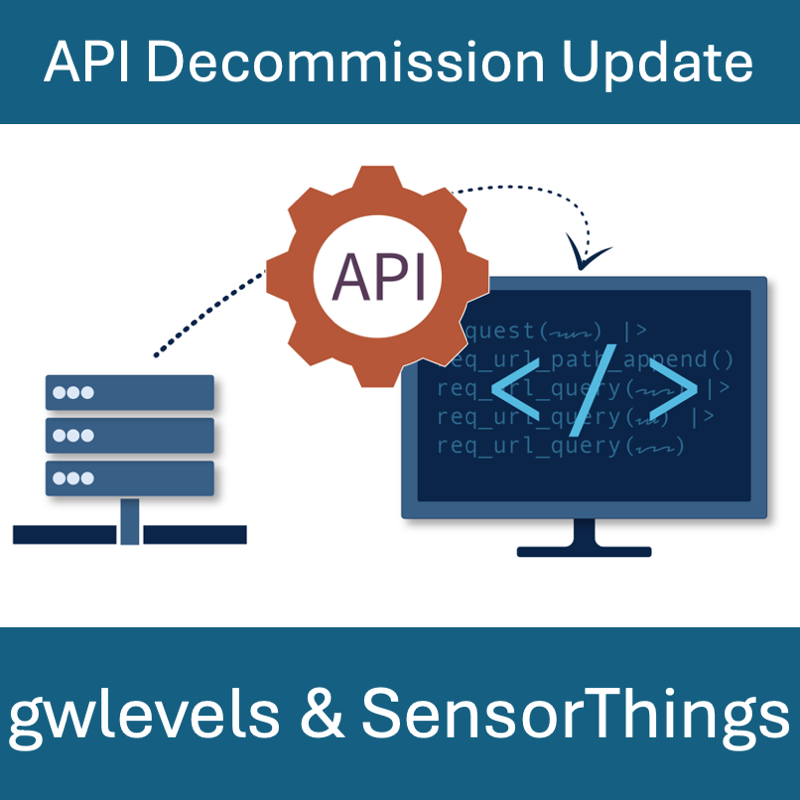
We are releasing new, modernized Water Data APIs this year and are beginning the process to decommission legacy APIs. This blog discusses the decommissioning of the “gwlevels” and “SensorThings” APIs. The gwlevels API will be decommissioned beginning November 1st, 2025. The SensorThings service will be decommissioned on December 9th, 2025.
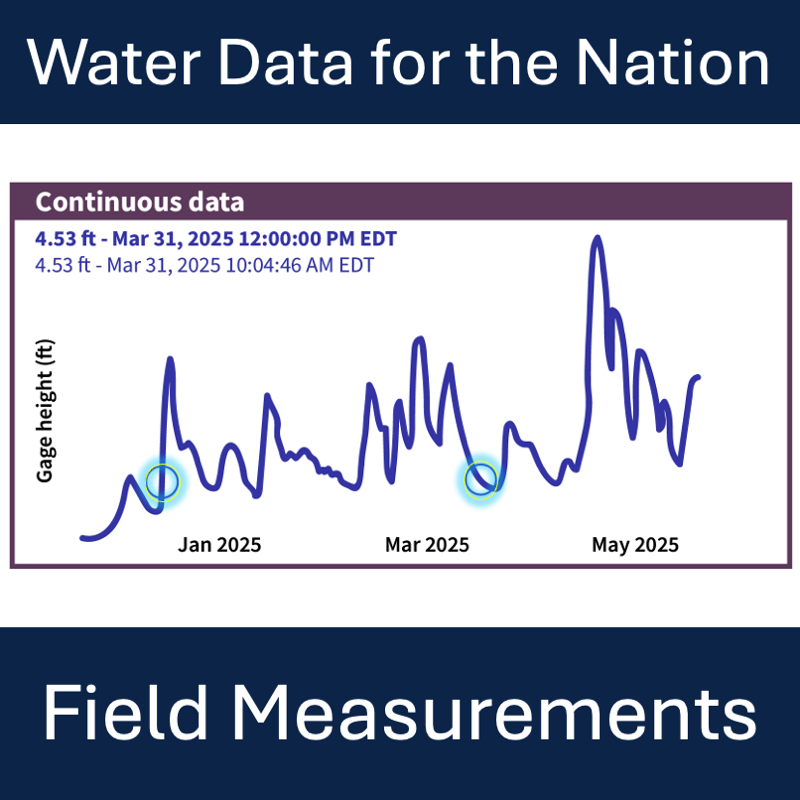
Where to find and download field measurements in Water Data for the Nation

Reproducible workflows that provide the data and tools for you to get started making your own 3D graphics of topographic, satellite, and water data

Add assertion tests to your functions to ensure assumptions are met and errors are helpful.
This blog post demonstrates how we used the core principles of user-centered design, “learn,” “build,” and “refine” to modernize Water Data for the Nation (WDFN)
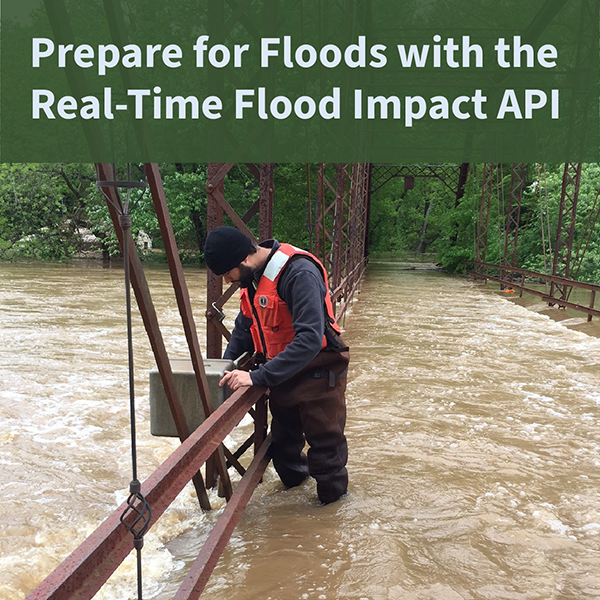
The USGS Real-Time Flood Impact (RT-FI) API service helps communities protect lives and property by providing flood risk context to widely-available USGS streamgage height measurements.
Modernization and decommission of statistics delivery for USGS Water Data for the Nation
What to expect from modernized replacements to the WaterServices family of APIs.