
Next Generation Monitoring Location Pages Update
Our Next Generation Monitoring Location Pages continue to receive updates based on our priorities and your feedback. Key features in this update include improved controls of the hydrograph and increasing the amount of at-a-glance information.
We are excited to announce a new release of the Next Gen Monitoring Location Pages! There have been many updates to the way you view and interact with the hydrograph plot. The hydrograph is larger and has a clearer display of the monitoring location, time span, and data that is plotted. We’ve made it possible to zoom and pan in the hydrograph to allow you to look at exactly the data you want—scroll with your mouse on the graph to zoom or click and drag to pan on desktop, or pinch to zoom or touch and drag to pan on mobile.
We are grateful for all of you who have reached out with your points of confusion while using the monitoring location pages, thoughts on key features, and details on how you use our data. A reoccurring theme from your feedback was difficulty understanding how to control the hydrograph and missing insight on the data being displayed. Two major updates in the latest release: to provide more at-a-glance info close to the hydrograph and consolidating page content that is related to the hydrograph data to help you get the most out of the data available.
Data details and statistics
The new Data Details view provides an organized way to see the data values you are focused on in the graph, as well as quick access to the latest value recorded at the monitoring location. This is also where you can select to compare the current data to last year or add the median data to the hydrograph. The daily statistics are now in a more prominent place on the page near the Data Details section for parameters that have those statistics available.
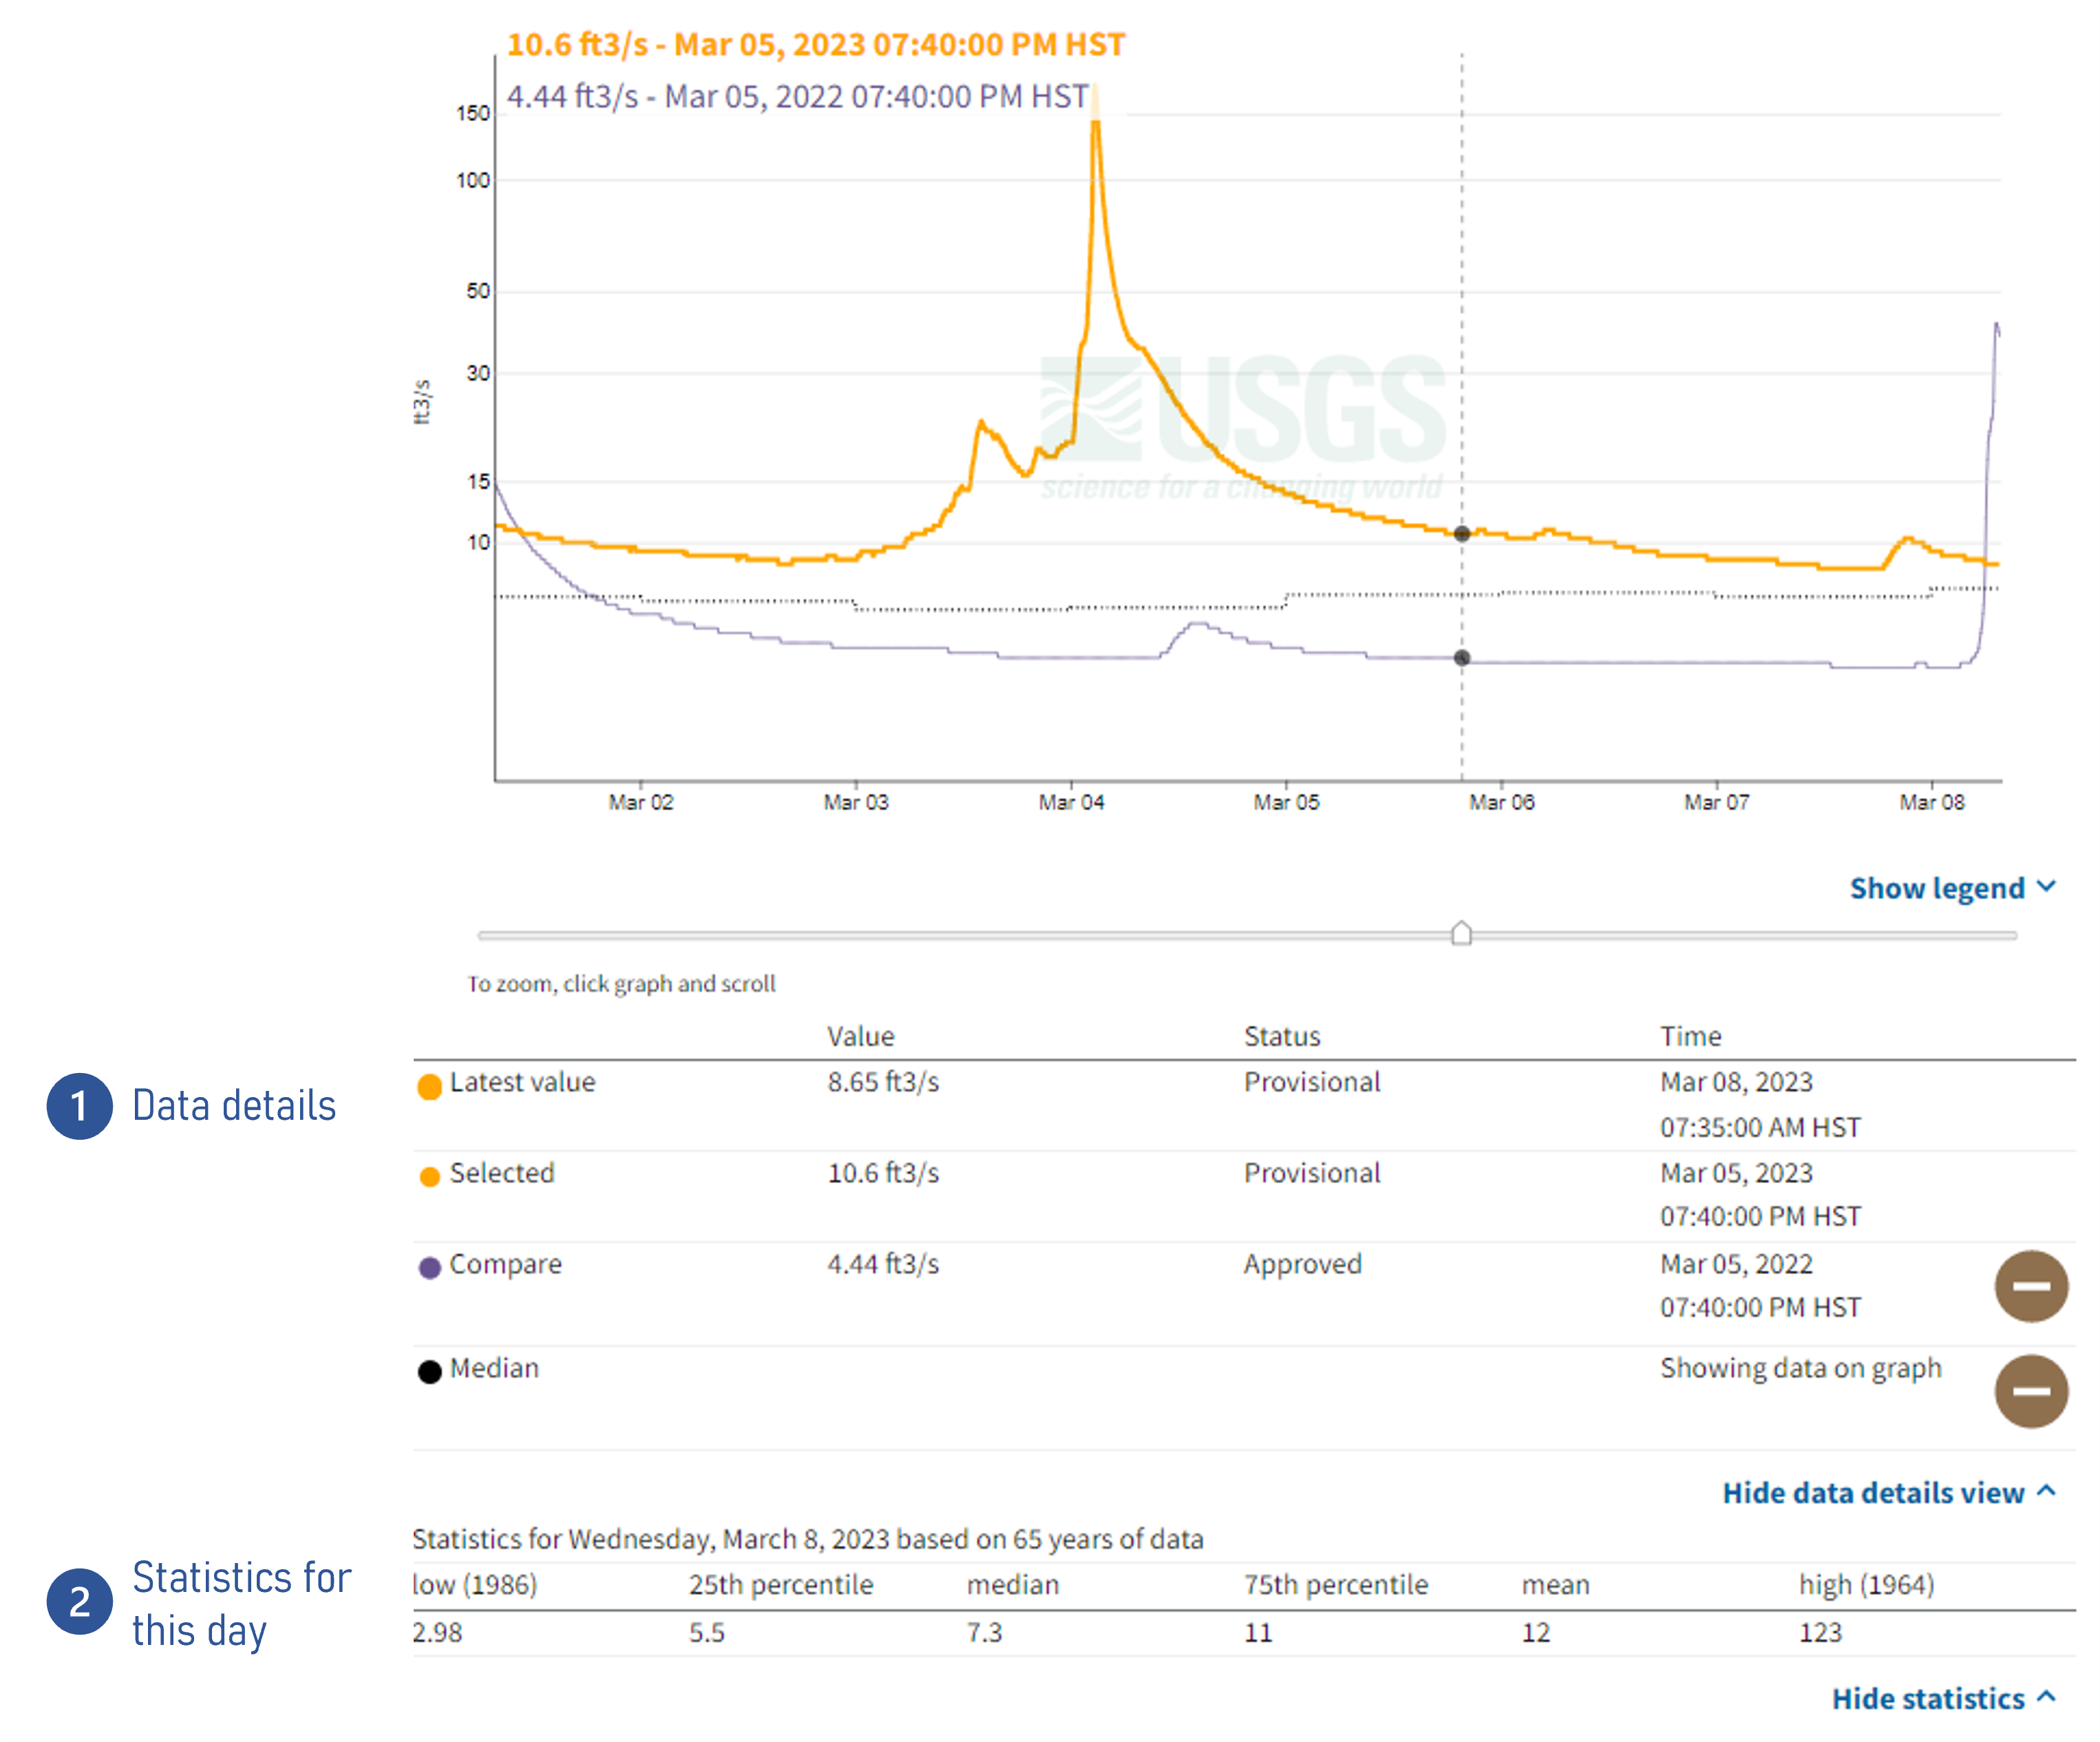
Data details view highlights both the latest value as well as allows you to track where your cursor is on the data. The controls for adding in last year’s data and median lines to the hydrograph have been moved into this view for easy selection. The statistics for this day have been promoted out of an accordian to be always in view to help you understand how today’s data compares to data recorded on this date over our long records.
Consolidation of content related to the hydrograph
Other sections of the page have been re-organized and consolidated into buttons where you can change the time span, subscribe to WaterAlert, download data, or view the plotted data in a tabular format. You can select a custom time span you’re interested in by entering the dates or number of previous days, in addition to the time span options included at the top of the hydrograph. Clicking these buttons on and off lets you show or hide their contents.
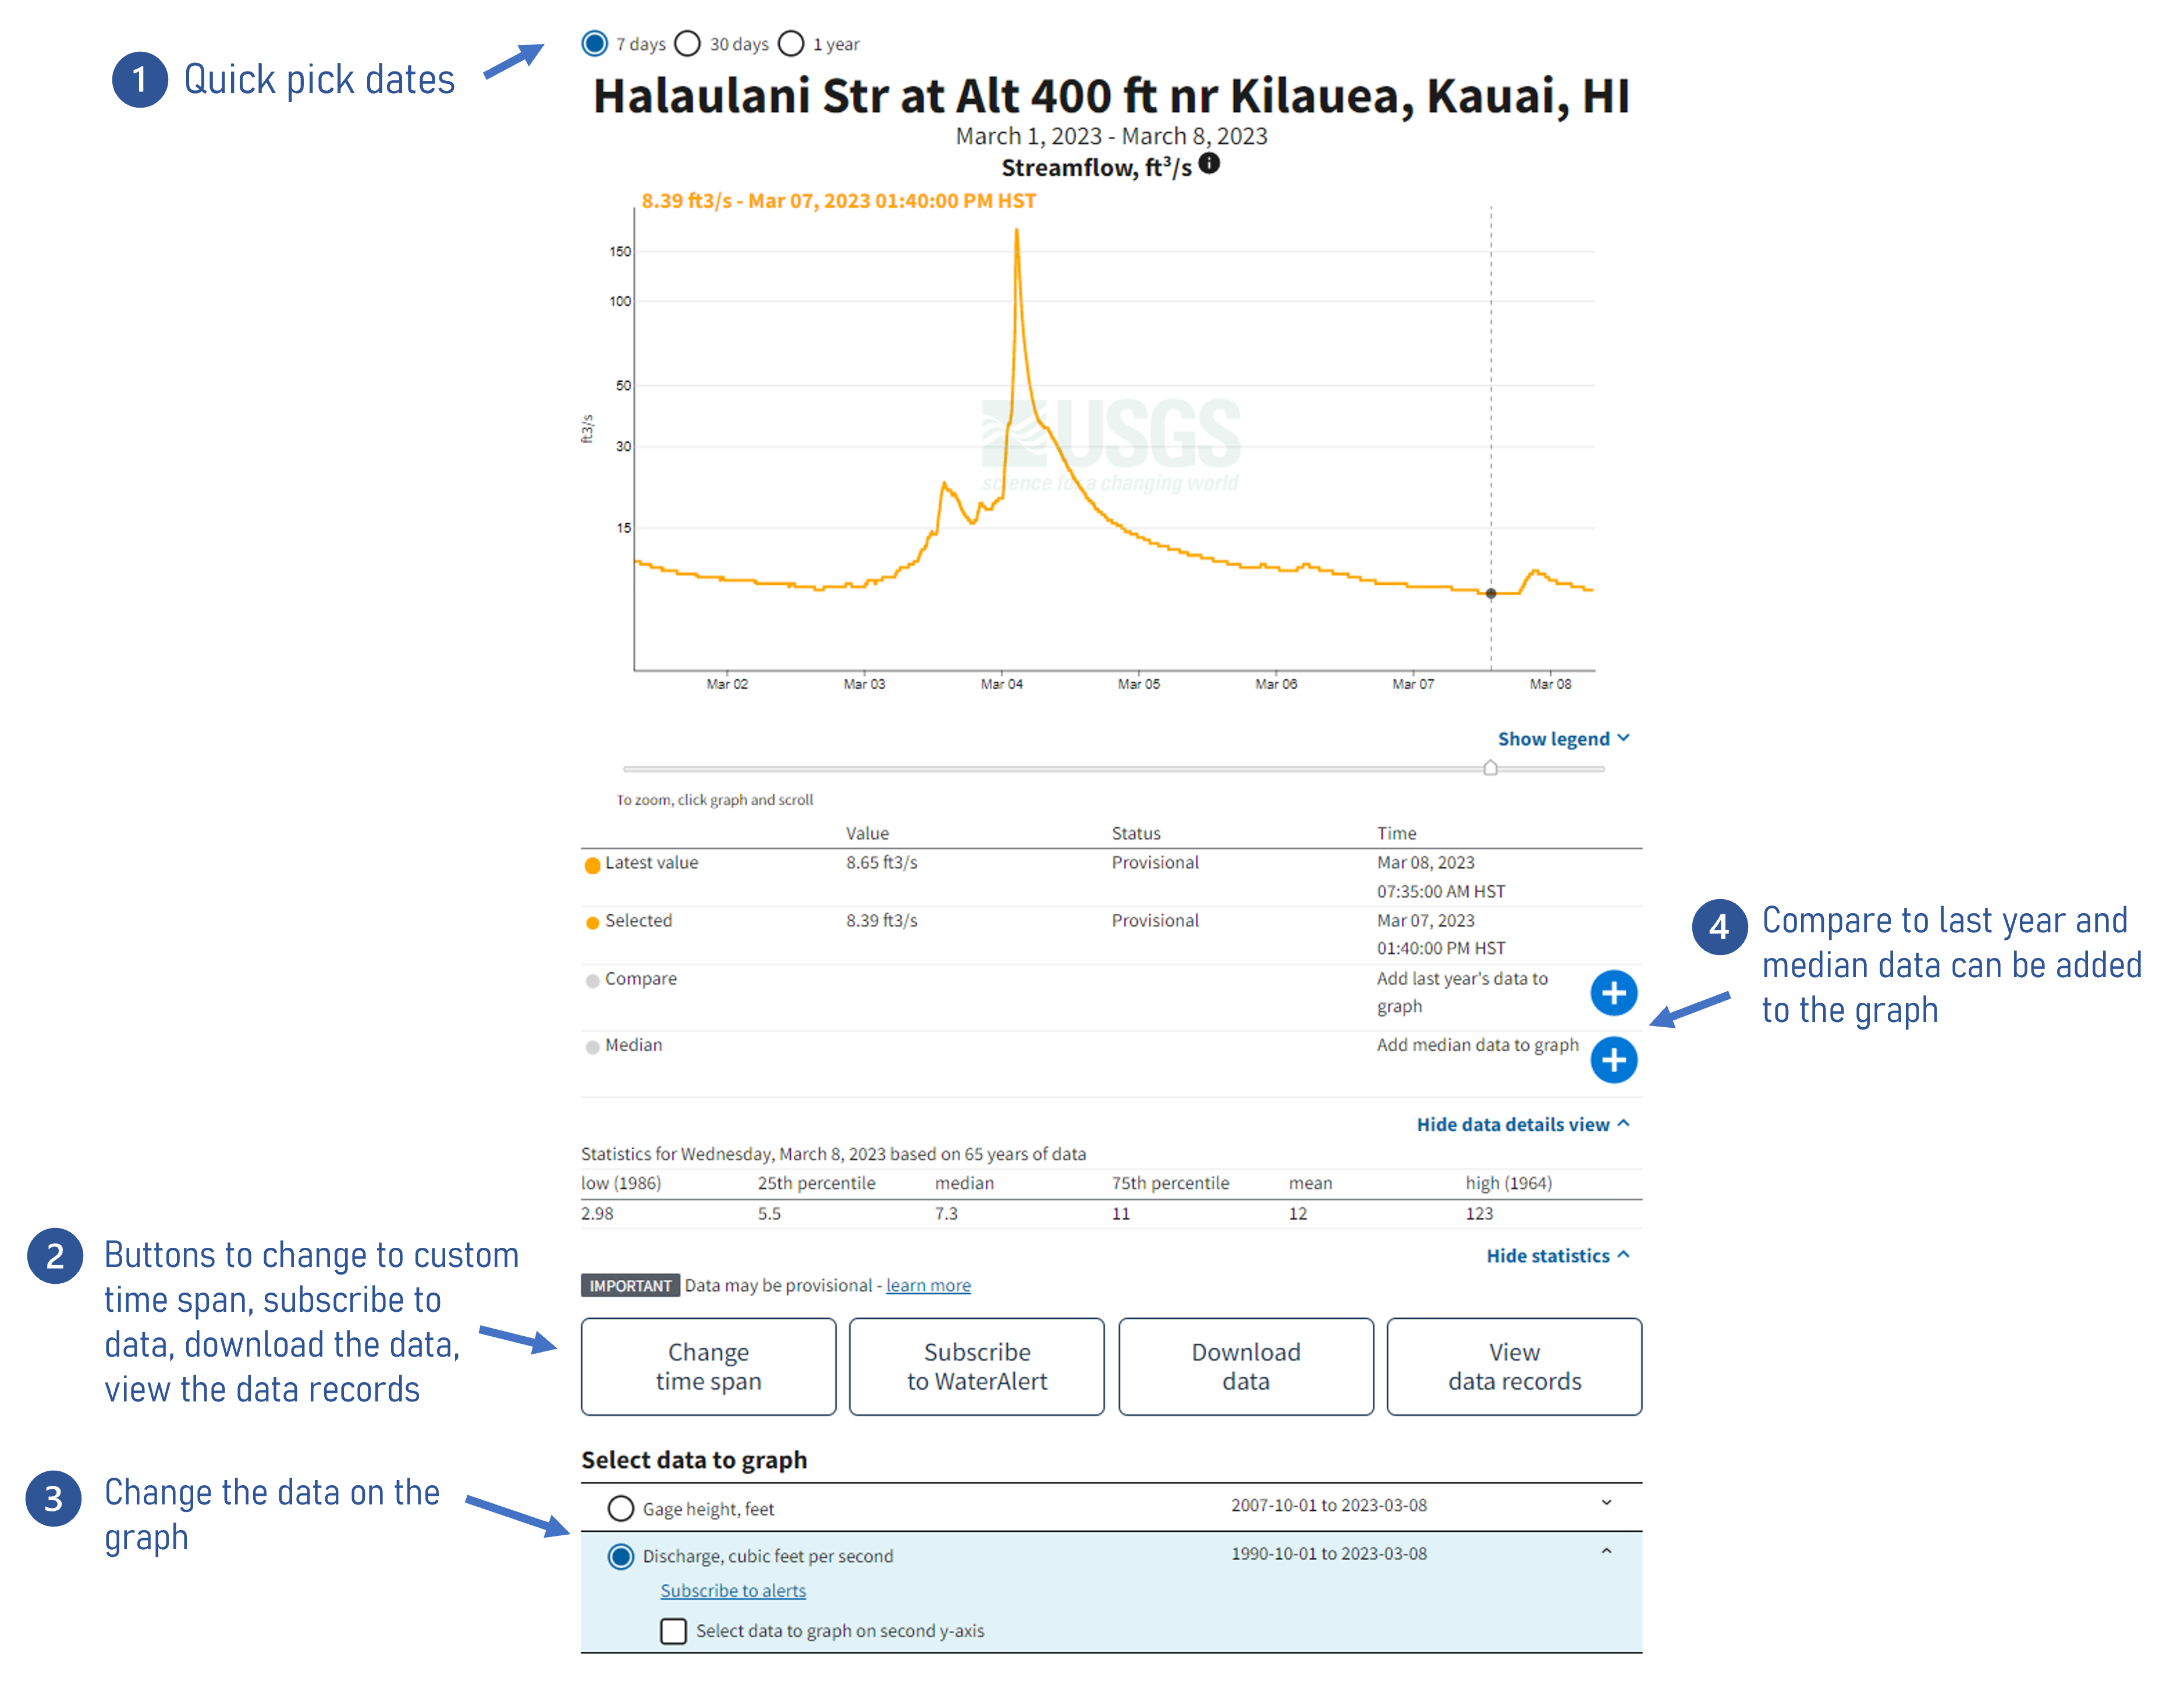
Hydrograph controls and related views into the data are located in similar places, moving features that had been spread out on the page. Four places to look for controls: above the graph for quick pick dates, in the data details table to add last year’s data or the median to the graph, 4 buttons of common interactions with the data (custom time span, subscribe, download, records), and the select data to graph section to reset the main data on the graph.
Other released features
✔ Zooming the hydrograph on desktop, a well liked feature on mobile!
✔ There will no longer be duplicated y-axis values when the range of data values is small.
✔ Log plots will now only be used if the range of data spans over half an order of magnitude.
What’s next for us?
Our next steps include adding in-page navigation to make it easier to move between the sections of the page you’re most interested in and re-organizing some of the content you see on the monitoring location page. Please let us know of any suggestions you have for improvements or issues you experience on the Monitoring Location Pages using the Questions or Comments form linked at the bottom of the page.
Get involved! Have your voice heard
Want to test the multi-station feature in beta? Email us: wdfn_usabilitytesting@usgs.gov with the subject: Multi-Station Feature.
Related Posts
Data Graphs in Water Data for the Nation
June 22, 2023
We have been hard at work designing how to view our water data on graphs in Water Data for the Nation (WDFN). Right now, the primary option is monitoring location pages which have a graph that can look at data over the entire period of record, but this year we’re introducing two additional options to view graphed data!
Water Data for the Nation in 2023
April 19, 2023
What is Water Data for the Nation? Water Data for the Nation (WDFN) is the home for USGS’s modernization of public delivery of water data. USGS water data can be accessed by the public in many ways:
Redirecting the Next Generation Monitoring Location Pages
October 14, 2022
During the week of October 17th, many links to legacy real-time pages will be redirected to the Next Generation monitoring location pages. This means that bookmarked links to the legacy real-time pages will be redirected automatically to the NextGen monitoring location pages.
Next Generation Monitoring Location Pages Update
May 6, 2022
Last updated August 12th, 2022 On April 11th, we hosted a public webinar during which we updated our stakeholders on the progress of replacing Legacy real-time pages with Next Generation Monitoring Location Pages .
WDFN Quarterly Newsletter
May 24, 2022
Did you know that we have a quarterly newsletter? Check out our latest edition! Screenshot of the beginning of our Spring 2022 WDFN Newsletter .