
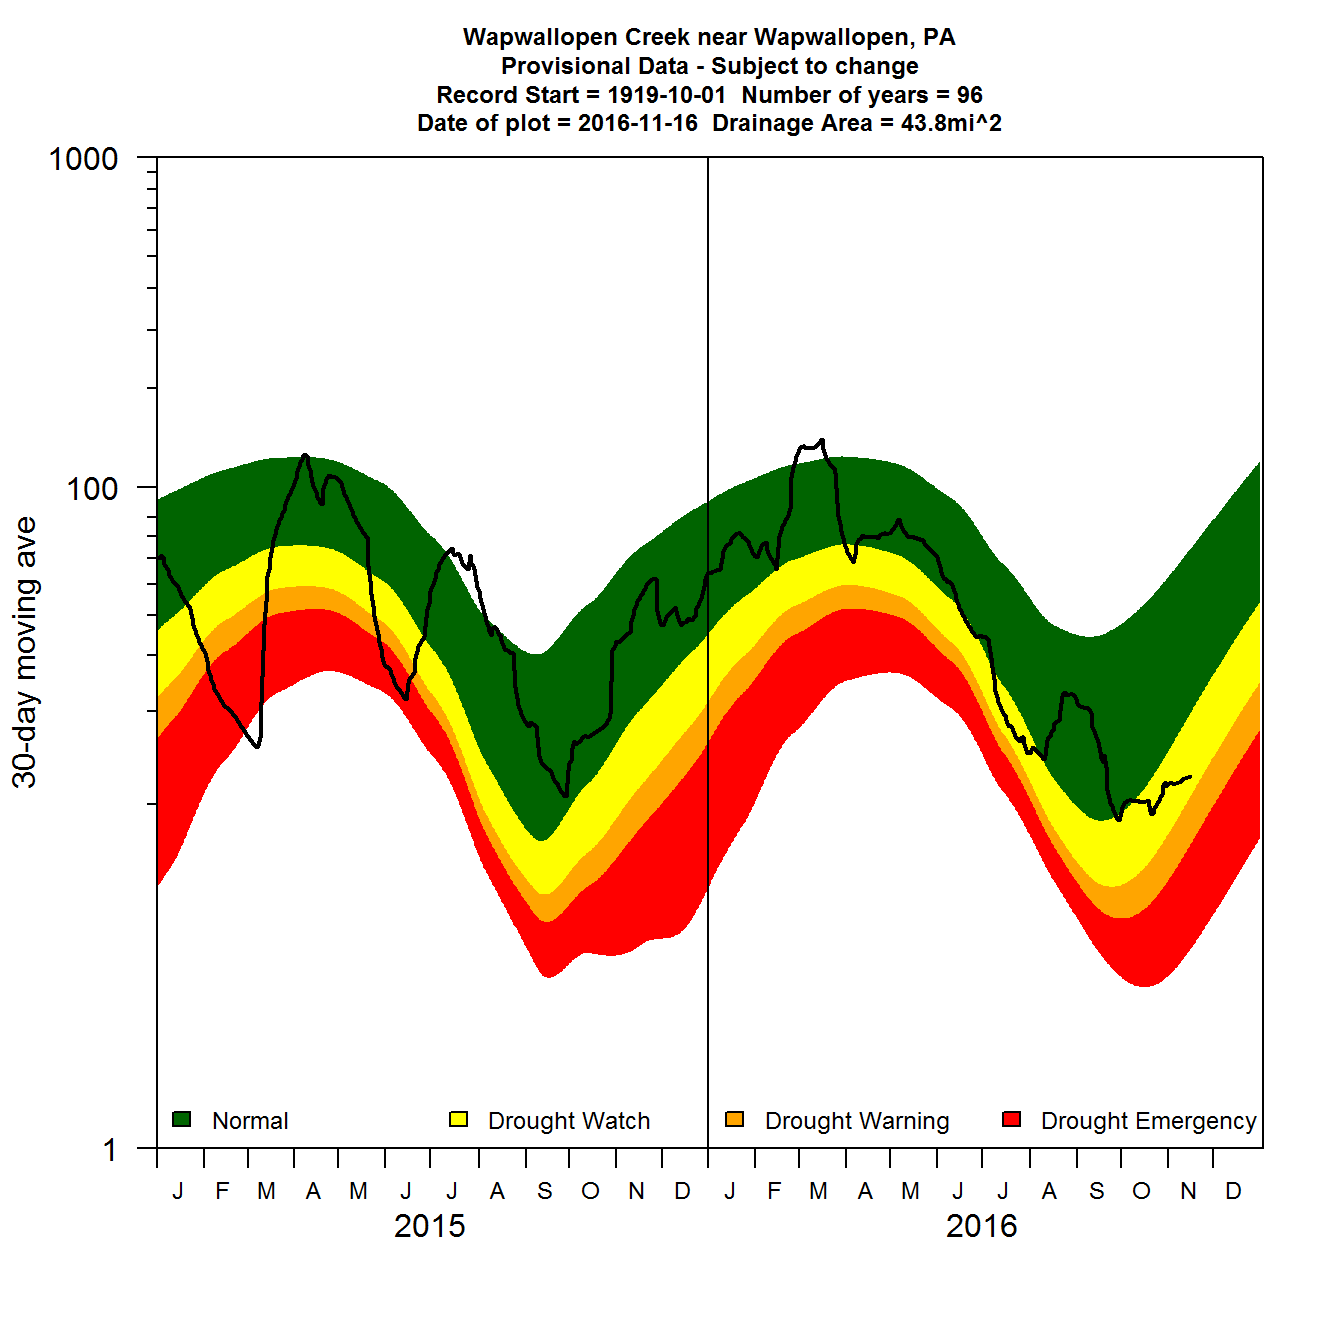
Using the R-packages dataRetrieval, dplyr, and ggplot2, a simple discription on how to create a moving-average plot with historical flow quantiles.
Official websites use .gov
A .gov website belongs to an official government organization in the
United States.
Secure .gov websites use HTTPS
A lock (
) or https:// means you’ve safely connected to the .gov website. Share
sensitive information only on official, secure websites.
Using the R-packages dataRetrieval, dplyr, and ggplot2, a simple discription on how to create a moving-average plot with historical flow quantiles.