
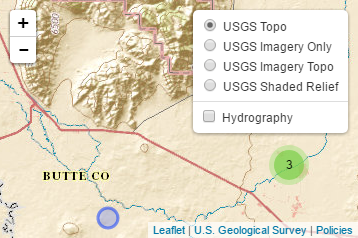
Integrate The National Map services within your own interactive web map using Leaflet for R.
Official websites use .gov
A .gov website belongs to an official government organization in the
United States.
Secure .gov websites use HTTPS
A lock (
) or https:// means you’ve safely connected to the .gov website. Share
sensitive information only on official, secure websites.
Integrate The National Map services within your own interactive web map using Leaflet for R.
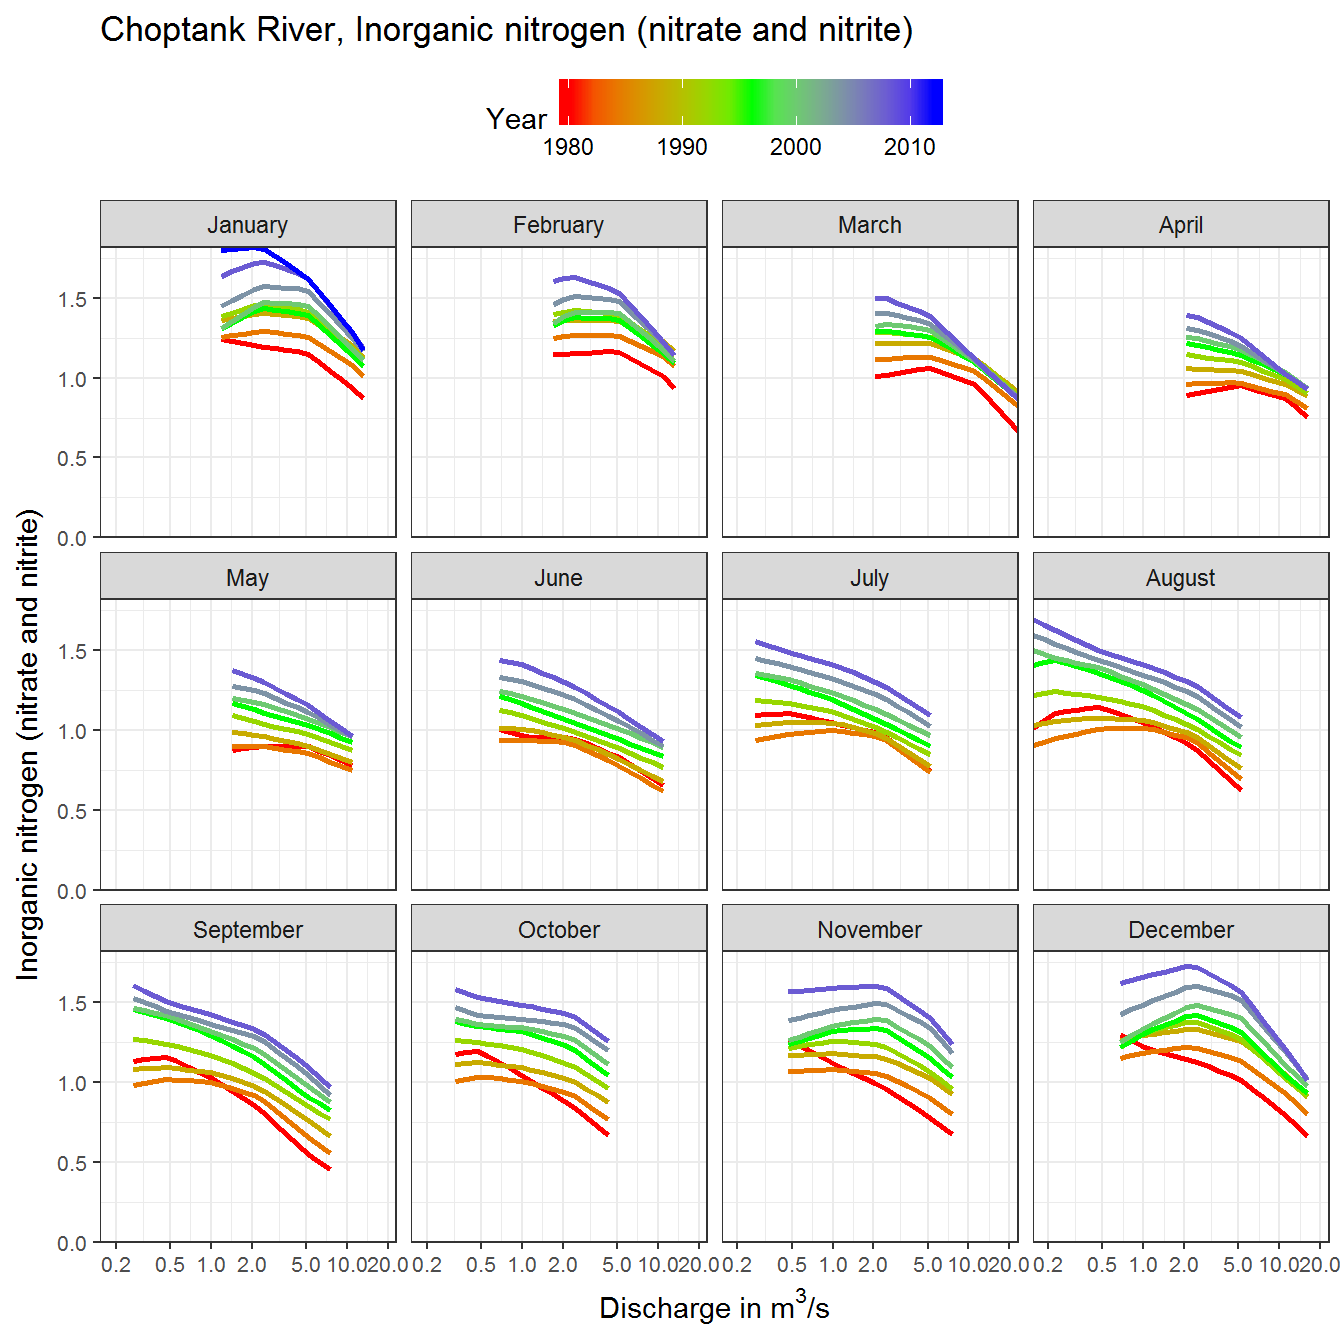
Using the R packages, ggplot and EGRET, a new function plotFlowConc shows a new way to visualize the changes between flow and concentration.