
New Feature - My Favorites
Feature to maintain a list of monitoring locations you are interested in and to see the latest values of real-time data.
We are excited to announce a new page called My Favorites . This page allows users to create a custom list of monitoring locations that can be bookmarked and shared for repeated viewings of key locations.
My Favorites is a centralized place to keep track of the monitoring locations you are interested in. The latest values for real-time data are available at-a-glance with an emphasis on helping you navigate to related data pages like All Graphs and the Monitoring Location Page which have graphs for trend analysis. This page is intended to be interactive, with easy access to customization options and the capability to share the configured URL with your collaborators.
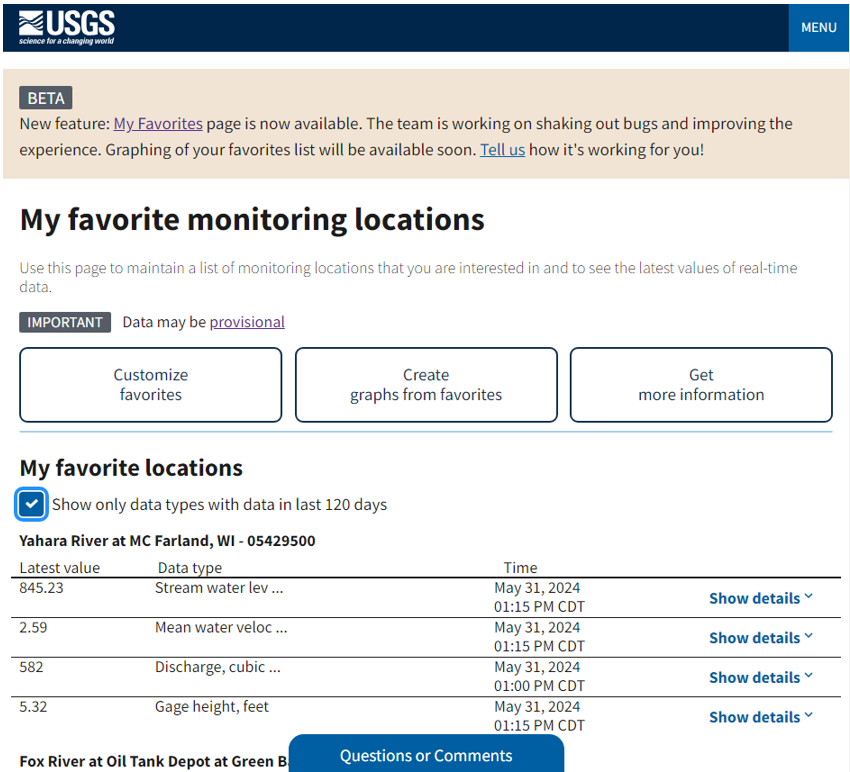
My Favorites featuring a series of buttons for you to change what locations and data are on the list, interact with the Combined Location Graph and My Favorites-graphed, and interact with the underlying data on the page. This is paired with a list of the latest real-time data for all locations for easy at-a-glance information
My Favorites is a new offering to ensure our modernized web presence continues to meet the needs of our users. This is the first of the network pages we are developing, which groups and summarizes data from multiple locations and connects to specialty pages for more information. As Water Data for the Nation replaces our legacy NWISWeb, we are reviewing content, talking to users, and ensuring that major use cases are supported in our new system. Learn more about how this page, as well as other new features, fit into the WDFN ecosystem .
Key Features
My Favorites shows a list of monitoring locations you’ve added and the latest value for all real-time data collected at each location. You can click the check box at the top to limit the list to data available within the last 120 days.
The action buttons across the top of the page allow you to customize your list and connect you with other sources of data and information about your favorite monitoring locations.
In the “Customize favorites” button you can change the locations and data types that show in your favorites list. You can add locations to your list using the monitoring location identifier and remove them with the check boxes in Step 1.
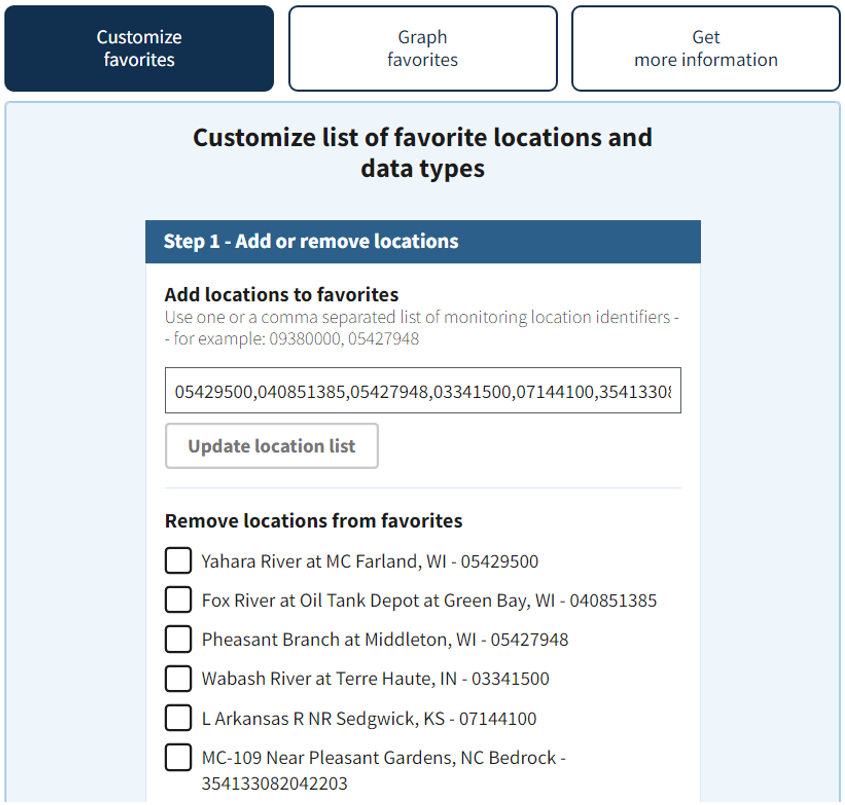
Add locations to My Favorites using a comma-separated list under the “Customize favorites” button. Locations can be removed from the list through a series of checkboxes with the location name to help determine the right location to remove.
In Step 2 you can alter the data types shown in your favorites list. Review the data types and the count of your favorite locations where the data type is available and use the Select All/None option at the top right of the list or the checkboxes to customize the data types in your list.
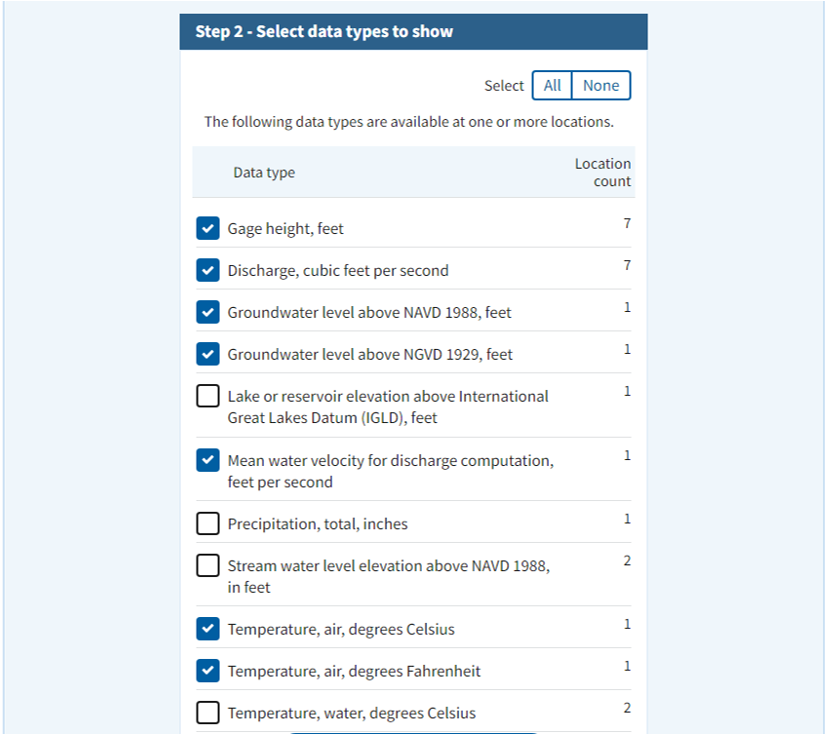
Specify which real-time data shows up in the list with an indication of the data type and number of locations that serve that data type to help provide information on how widespread the data type is.
The My favorite locations list shows you the latest value for all real-time data types. Convenient access to data graphs is available in the expandable Details section under each data type in your favorites list with links to the Monitoring Location Page and All Graphs page.
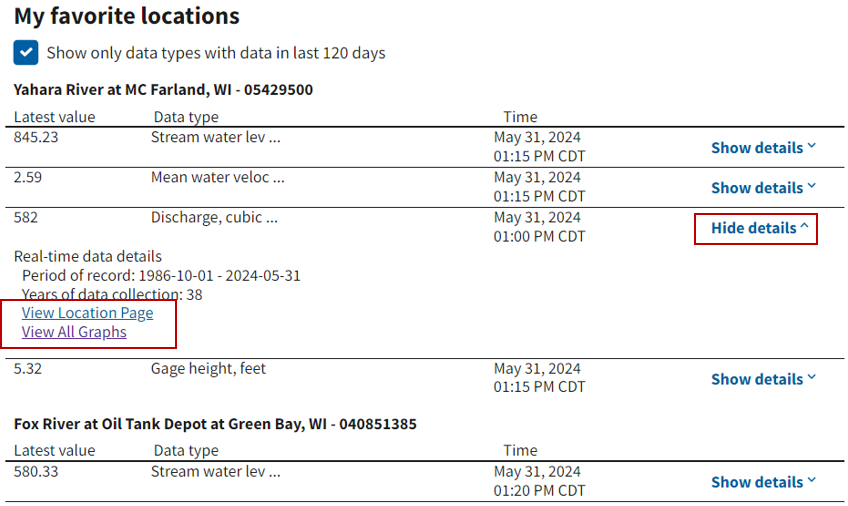
Access the Monitoring Location Page and associated data graph pages by selecting Show details for any data in the My favorite locations list. Links are available to associated data graphs.
You can also create graphs from the locations in your favorites list using the action button “Graph favorites”. There are two graphing options available—you can create a Combined Location Graph to display a single data type for multiple locations on a single graph, or create a My Favorites-graphed page, a new offering in WDFN where you can view any number of data graphs from all your favorite locations on a single page. To create a Combined Location Graph, select the first radio button in the graphing option, then follow the steps to select up to five locations from your favorites and pick a data type you would like to graph to create a link to your customized Combined Location Graph.
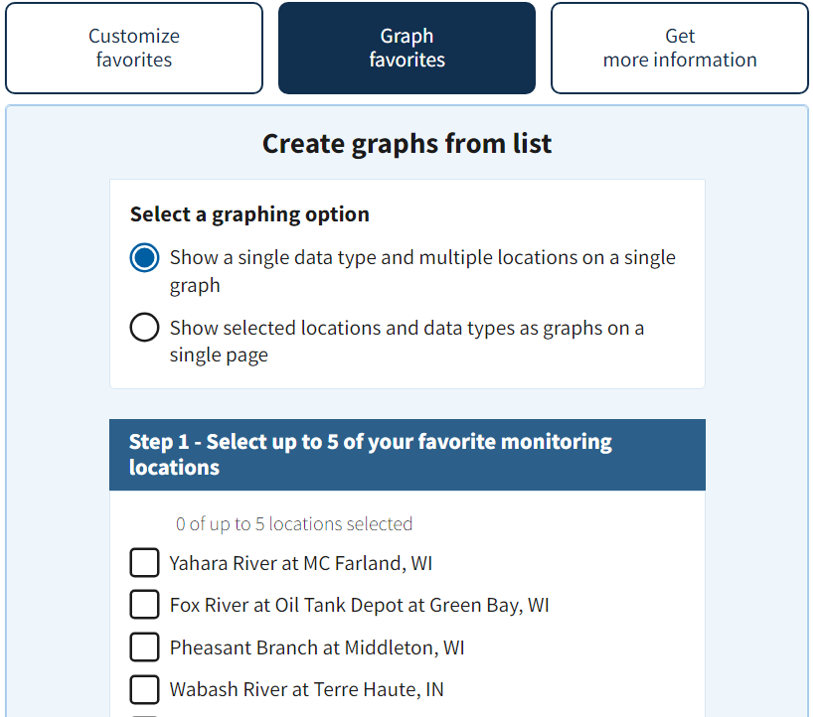
Create a Combined Location Graph under the “Graph favorites” button where you can select up to 5 locations and a single data type to graph from your favorites list.
To create a My Favorites-graphed page, select the second radio button in the graphing options, then select any number of data types from the locations in your favorites list in step 1. You can use the “All” and “None” selectors to quickly select and deselect data types to graph. In step 2, you will find links to view your graphs, with the option to group the graphs by location or to group by data type.
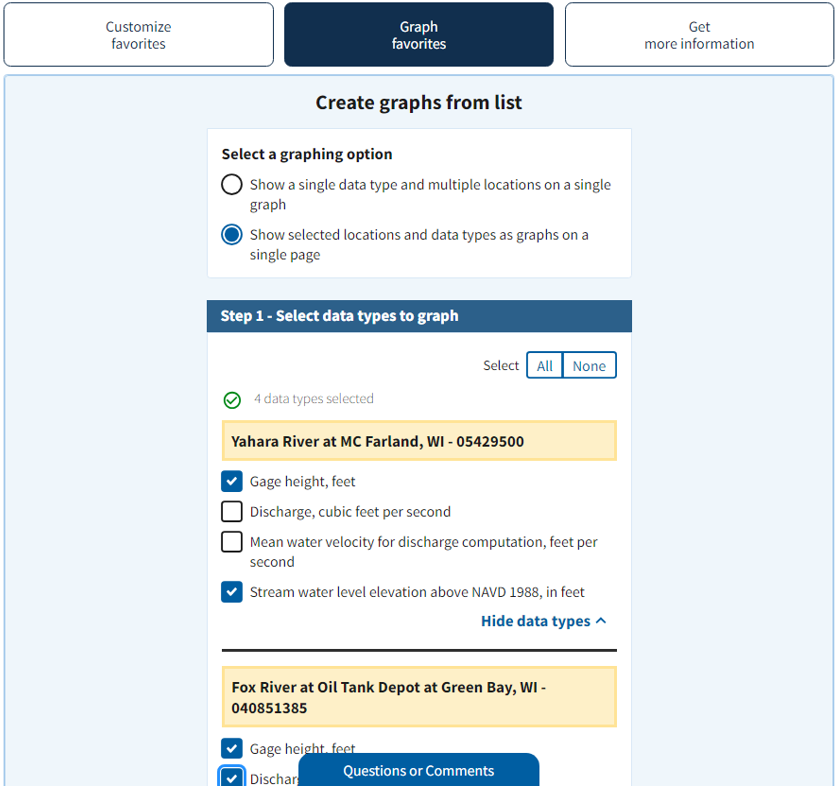
Create a My Favorites-graphed under the “Graph favorites” button where you can select any number of data types from your favorites list to see all the data graphs on a single page.
Once you click the link to My Favorites-graphed, you will see data graphs for all the data types you selected from your favorite locations. There are radio buttons to change the time span, with options ranging from 2 to 120 days. On each graph you can view the latest continuous data collected, and see operational limits, public reference levels, flood levels, and field measurements when available. There are links to take you to the location’s Monitoring Location Page or to subscribe to WaterAlert.
The My Favorites-graphed page can be bookmarked to make it easy for you to return to and view the graphs you’re interested in—all of your location and data type selections are stored in the URL. To change the locations or data types displayed on My Favorites-graphed, just return to My Favorites via the link at the top right of the page and change your selections to produce another customized list of graphs.
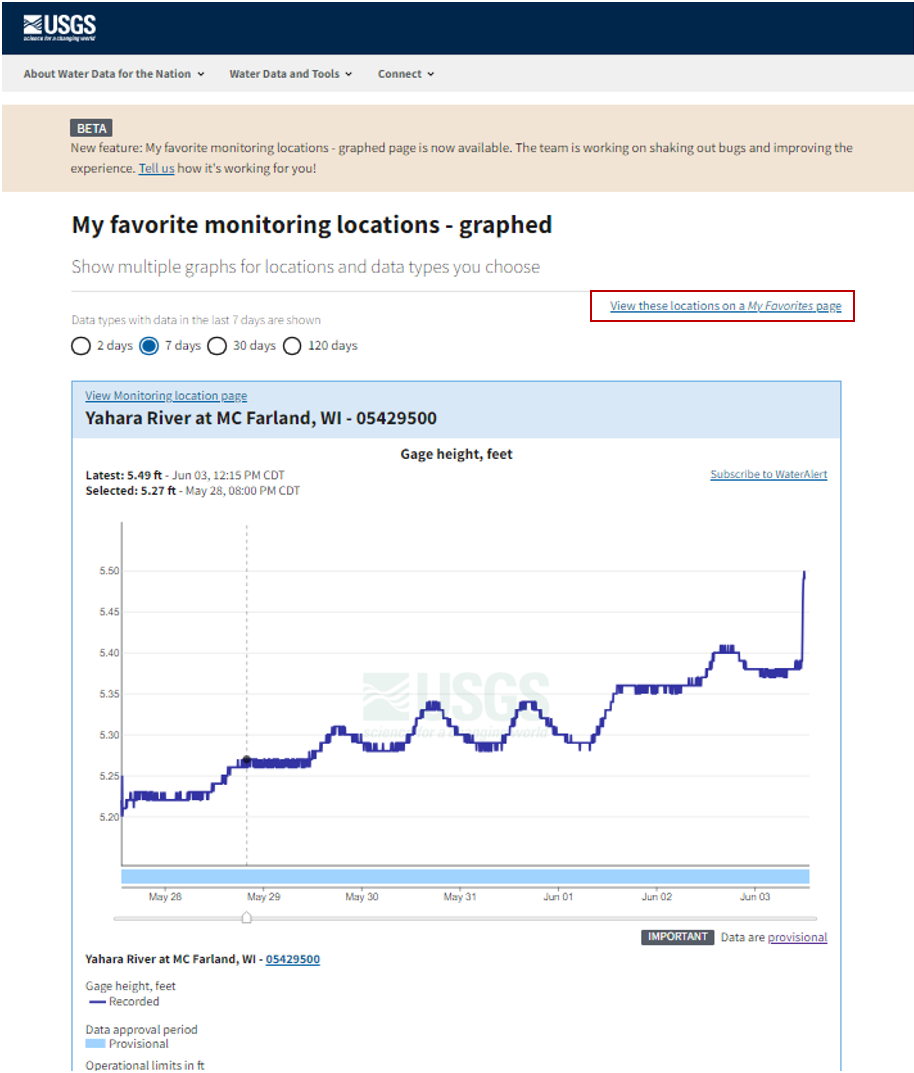
My Favorites-graphed shows a list of graphs for the data types you selected along with the option to change the time span displayed on each graph. You can return to your My Favorites using the link at the top right of the page.
My Favorites is designed to be easy to return to and share with others. The URL tracks all the location and data type choices you’ve made for your favorites list. You can bookmark the page in your browser or easily access the full URL to copy and paste through the “Get more information” button.
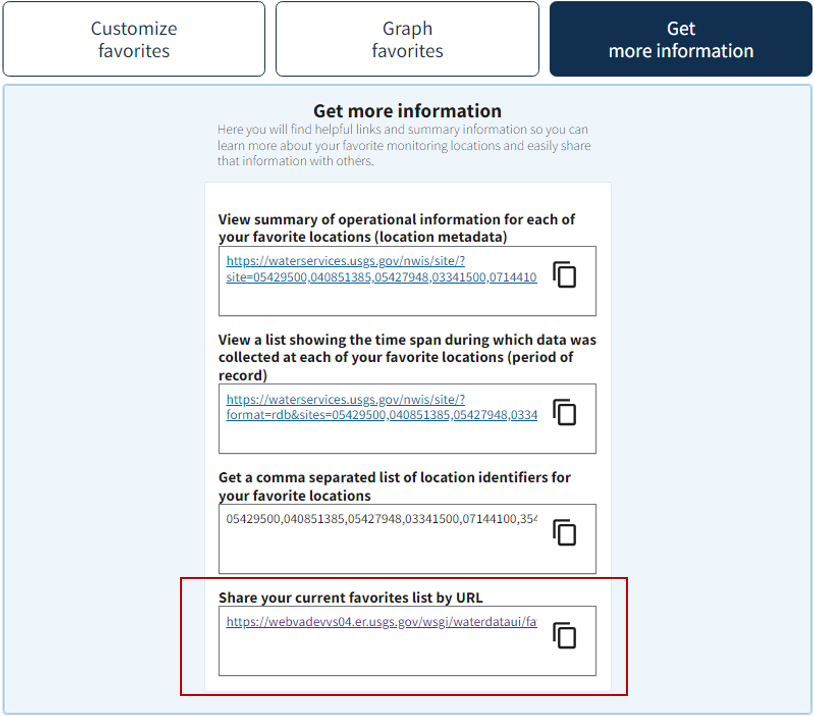
Get helpful links describing the page as well as the underlying data to learn more about your favorite monitoring locations and easily share that information with others.
What’s next?
My Favorites and My Favorites-graphed are currently in beta while we collect information on how they are working for our users. Our team uses user-centered design processes to determine what to prioritize next. Let us know how the page is working for you by emailing wdfn@usgs.gov .
Related Posts
New Feature - State Pages
October 28, 2024
State Pages now with Current Condition Estimates!
In early July 2025, we updated the State Pages to include current condition estimates, which compare current conditions against historical daily averages expressed as percentiles (example: West Virginia). Links to all of the State Pages are below.
Highlights from our 2024 WDFN User Survey
February 6, 2025
In October 2024 we asked people to answer a few questions about how they use Water Data for the Nation (WDFN), and over a thousand of you answered. We heard from people around the country, including 47 states, American Samoa, and Puerto Rico. We learned a lot from you and would like to share what we found.
New Feature - Data Collection Categories
January 30, 2025
USGS water data is collected at monitoring locations either by automated sensors or manual data collection. Prior to 2024, Water Data for the Nation (WDFN) primarily focused on delivering the data collected via automated sensors as our most popular data access category. In the past year, WDFN has added discrete sample data and has been working on including manual data collection. To help organize the different data, we are introducing the concept of data collection categories to describe all the ways the water data is collected. A new Data Collection Category description includes now five data collection categories which can be found on WDFN:
New Feature - All Graphs
June 6, 2023
We are excited to announce that a new feature is now available to Monitoring Location Pages as part of our modernization efforts. The All Graphs page will show a series of individual graphs of all current sensor data collected at a single location. This page has been highly requested by users who want to see all the graphs on a single page without any clicking—just like the functionality on the legacy Current Conditions page, but with exciting new features and improved usability on mobile devices.
New Feature - Combined Location Graphs
April 19, 2023
Graphing data for multiple locations on a single graph is here! As part of our modernization effort, we are happy to announce a new page from Water Data for the Nation. The new Combined Location Graph page allows users to view and share the latest data for up to 5 monitoring locations on a single graph. This feature was highly-requested by our users in order to replace and improve on legacy functionality.