Category: Data-Science
Use R to generate a video and gif similar to the Vizlab animation series, U.S. River Conditions.
A description of how the Water Data for the Nation software development team works.

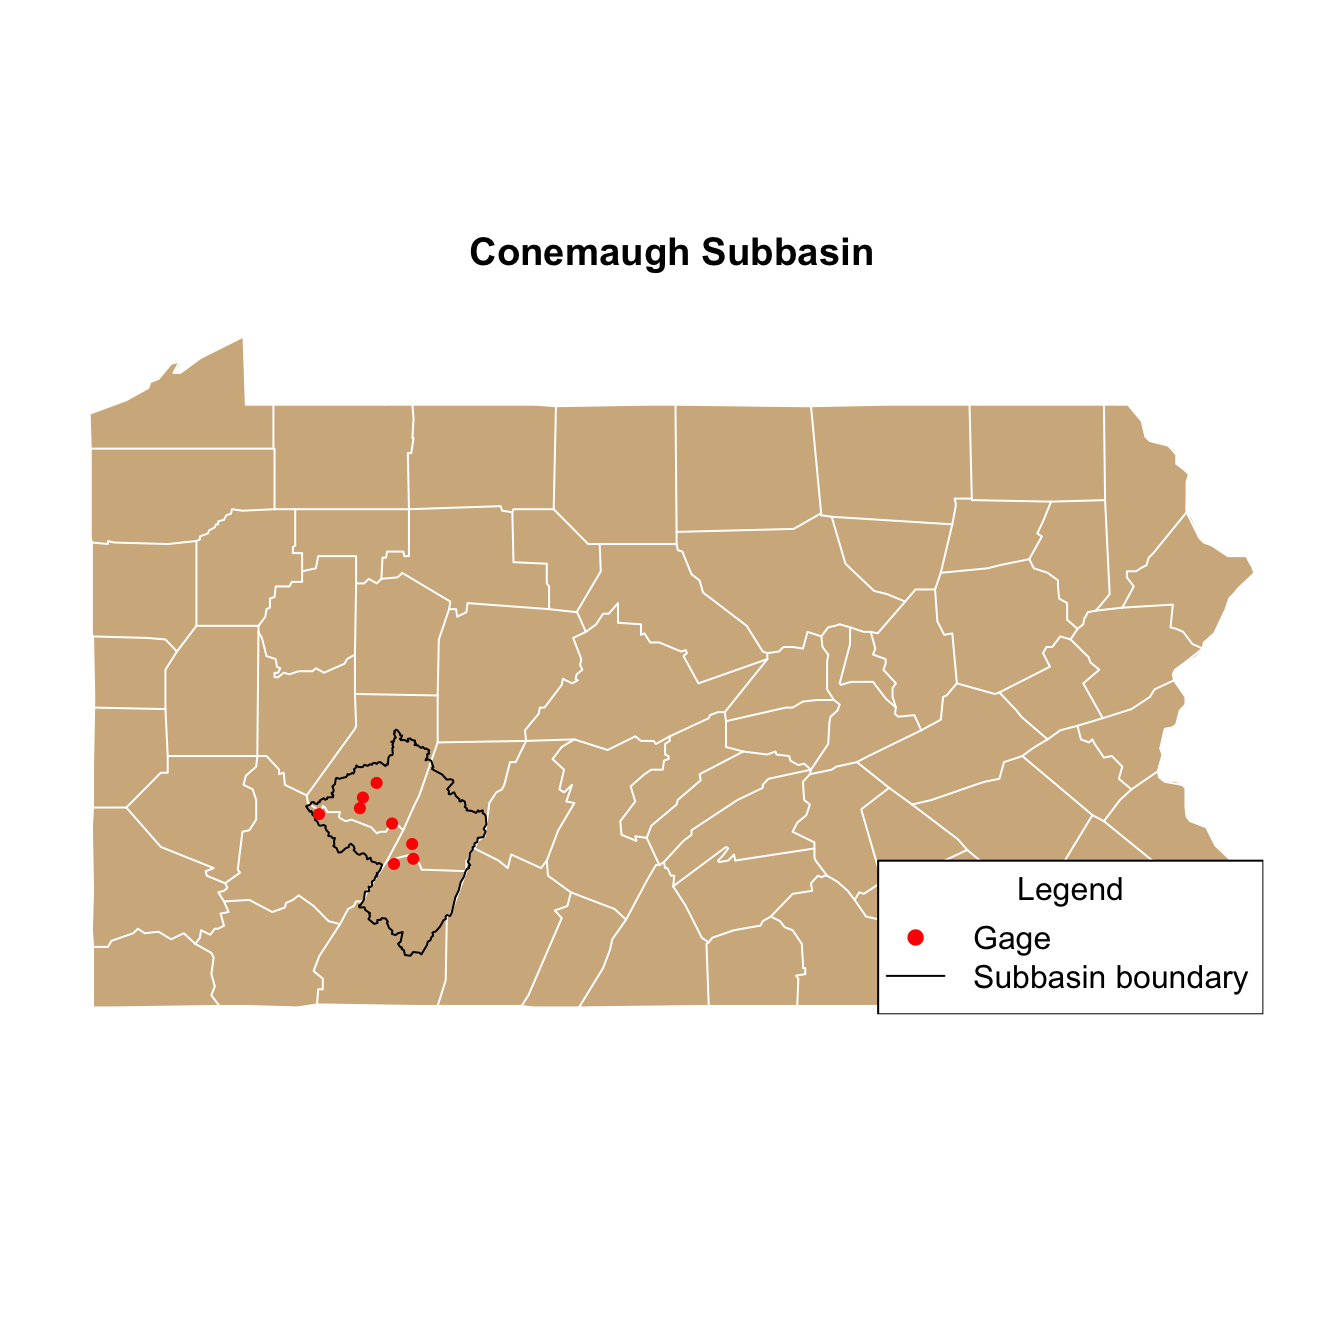
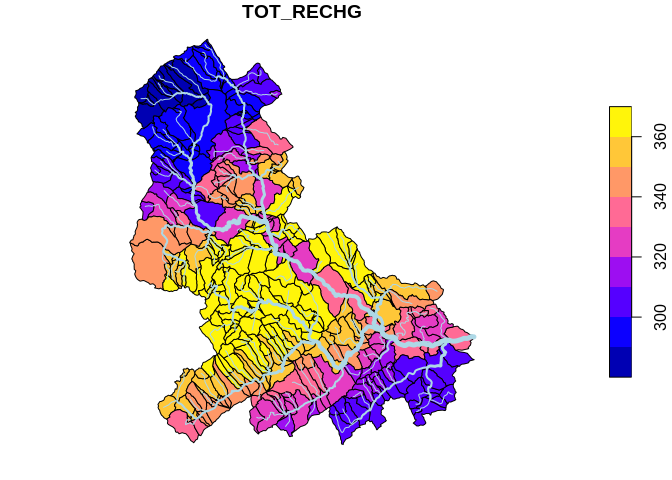
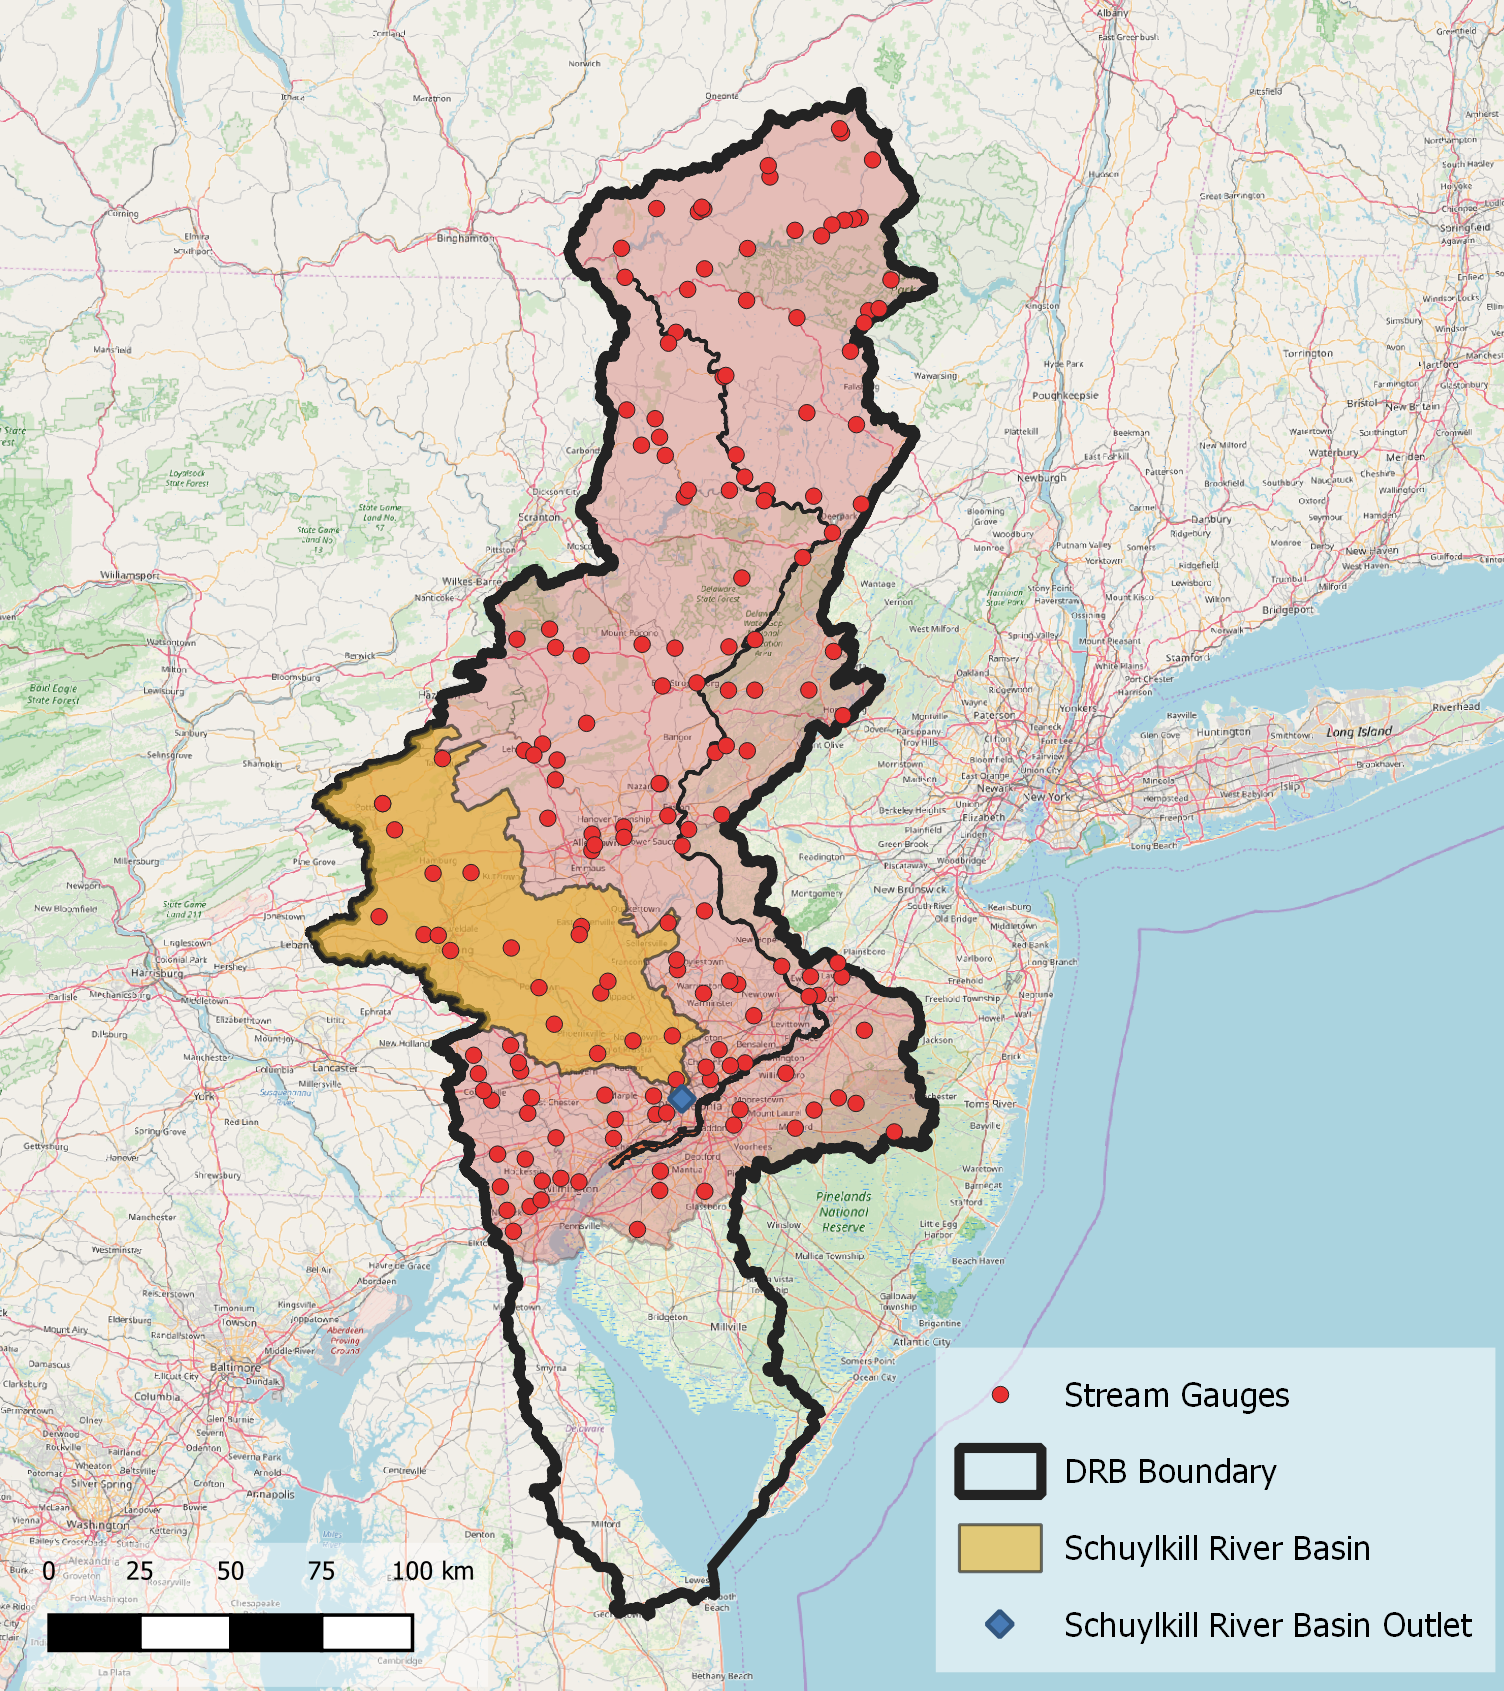
Access subsets of NHDPlus data and discover sites on the river network with the hydro Network Linked Data Index. Navigation types include upstream mainstem, upstream with tributaries, downstream mainstem and downstream with diversions. Services to provide a basin boundary, linked NWIS stream gage sites, water quality data sites, and twelve digit hydrologic unit code (HUC) watershed outlets.
An update on the Network Linked Data Index Web Application Programming Interface and Client Applications
Compressed formats, Zarr and Parquet scale much better for retrieving, reading, and storing USGS discharge time series data.
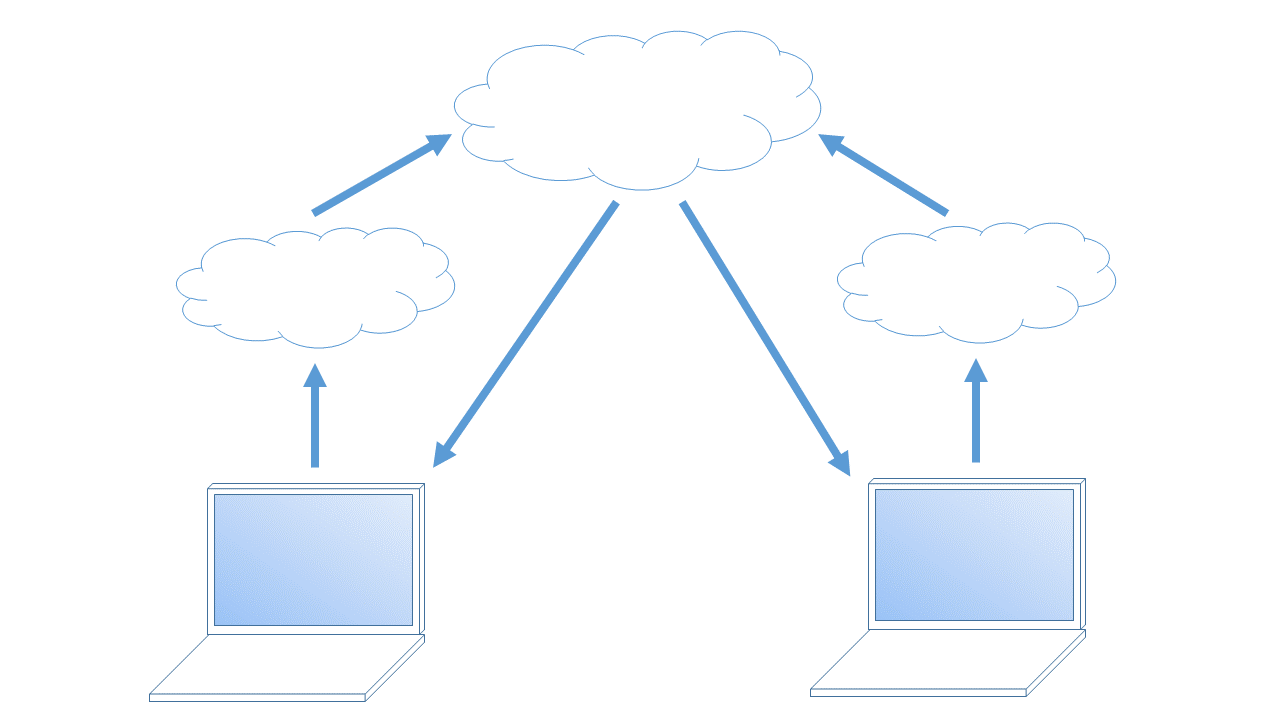
Brief introduction to version control, Git, and GitHub; plus, resources for learning more.