LOCATION.--Lat 44°52'16", long
74°59'30" referenced to North American Datum of 1927,
St. Lawrence County, NY, Hydrologic Unit 04150305, near
Louisville.
WELL CHARACTERISTICS.--Depth 179 ft. Upper casing
diameter 6 in; top of first opening 113 ft, bottom of last
opening 160 ft. Cased to 54 ft, open hole.
DATUM.--Land-surface datum is 246.88 ft above North
American Vertical Datum of 1988. Measuring point: Top of
coupling on extended casing, 4.16 ft above land-surface datum,
Sep. 14, 2004 to present; Top of extended casing, 3.9 ft above
land-surface datum, Sep. 14, 2004 to present; Top of shelter
shelf, 4.58 ft above land-surface datum, Jul. 9, 2014 to
present.
PERIOD OF RECORD.--June 1958 to November 1964, November
1985 to August 1995, October 2004 to current year.
GAGE.--Water-stage recorder--15 minute; periodic manual
measurements by USGS personnel. November 1985 to August 1995,
monthly tape measurement by observer.
REMARKS.--Satellite water-level telemeter at
station.
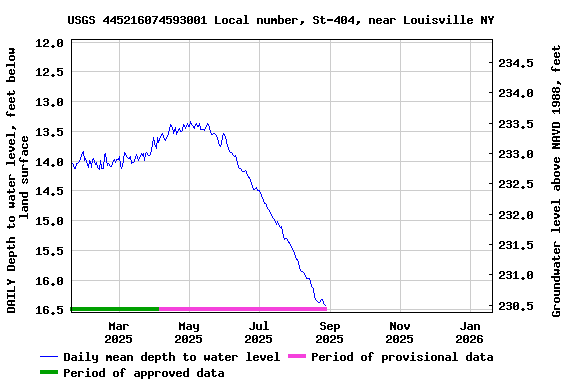
EXTREMES FOR PERIOD OF RECORD.--Highest water level,
11.83 ft below land-surface datum, Nov. 24, 1986; lowest water
level, 17.53 ft below land-surface datum, Sept. 3, 4,
2012.
 Site Information
 WaterAlert – get an
email or text (SMS) alert based on your chosen threshold.
WaterAlert – get an
email or text (SMS) alert based on your chosen threshold.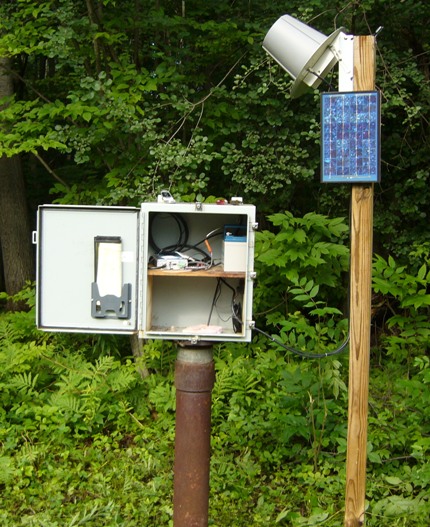 Station image