LOCATION.--Lat 43°12'27", long
75°23'33" referenced to North American Datum of 1983,
Oneida County, NY, Hydrologic Unit 02020004, at Griffiss Air
Force Base, Rome.
WELL CHARACTERISTICS.--Depth 52 ft. Upper casing
diameter 2 in; top of first opening 42 ft, bottom of last
opening 52 ft. Cased to 42 ft (screen, 42 ft to 52 ft).
Elevation of land-surface datum is 489.97 ft above NAVD of 1988
(levels by United States Air Force).
DATUM.--Land-surface datum is 489.97 ft above North
American Vertical Datum of 1988. Measuring point: Top of
shelter shelf, 2.74 ft above land-surface datum, Sep. 11, 2006
to Aug. 9, 2022; Top of extended casing, 2.47 ft above
land-surface datum, Sep. 9, 2016 to Aug. 9, 2022; Top of 2 in
PVC extended casing, 2.78 ft above land-surface datum, Aug. 9,
2022 to present.
PERIOD OF RECORD.--June 2003 to current year.
GAGE.--Water-stage recorder--15 minute; periodic manual
measurements by USGS personnel. Prior to July 2003, tape
measurement by USGS personnel.
REMARKS.--Satellite water-level telemeter at
station.
EXTREMES FOR PERIOD OF RECORD.--Highest water level,
40.19 ft below land-surface datum, June 4, 2007; lowest water
level, 45.22 ft below land-surface datum, Dec. 18, 2016.
 Site Information
 WaterAlert – get an
email or text (SMS) alert based on your chosen threshold.
WaterAlert – get an
email or text (SMS) alert based on your chosen threshold.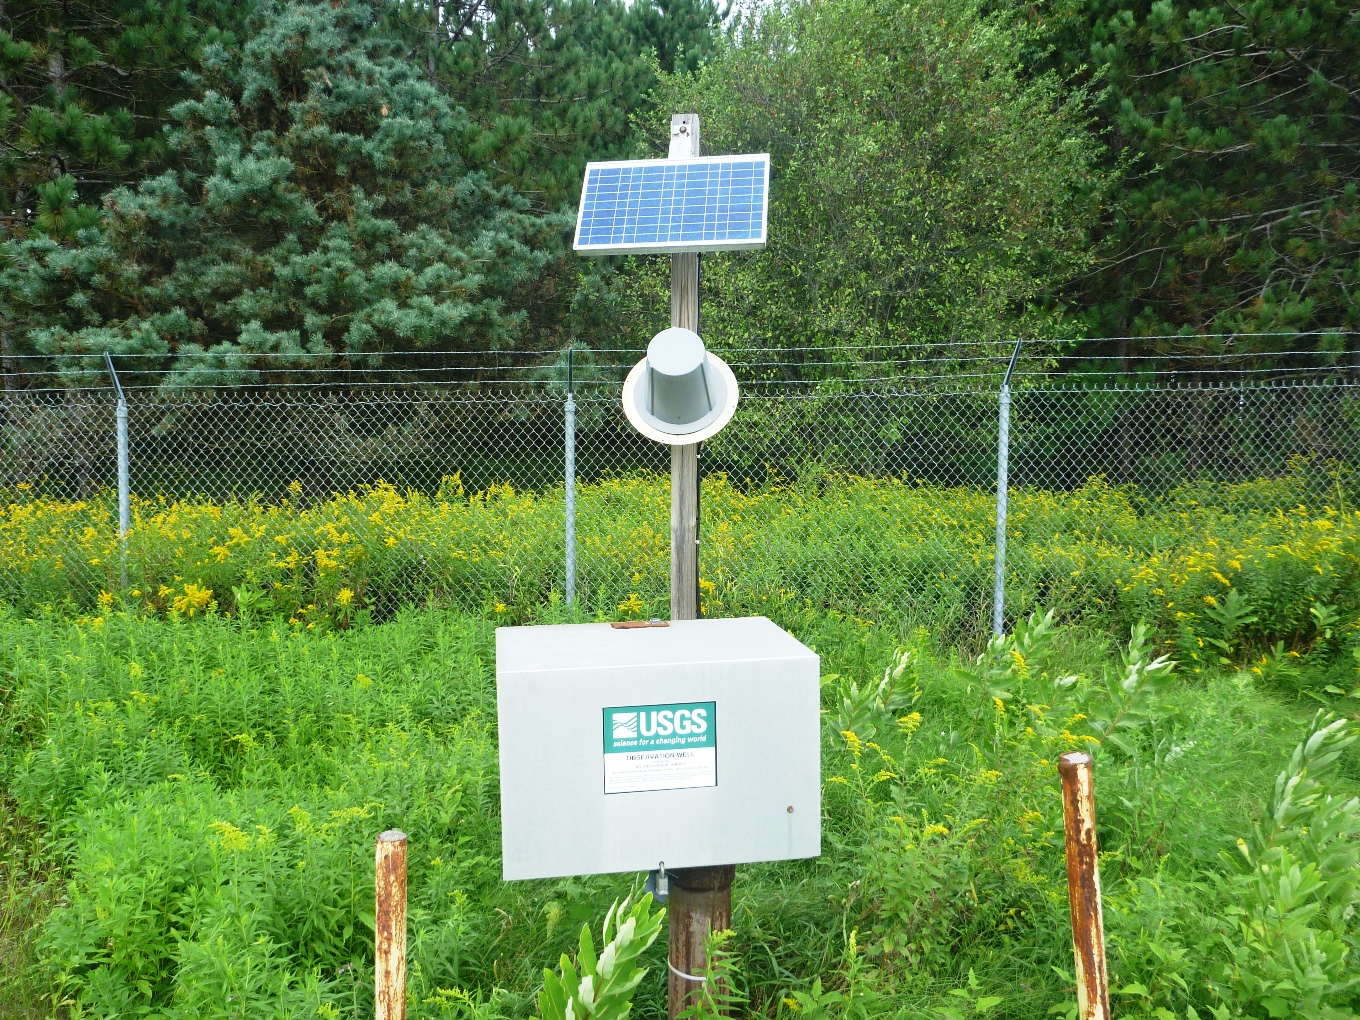 Station image