LOCATION.--Lat 43°08'42", long
77°30'43" referenced to North American Datum of 1983,
Monroe County, NY, Hydrologic Unit 04140101, on right bank
4,000 ft upstream from bridge on Blossom Road, 1.8 mi east of
Rochester, 1.7 mi downstream from Allen Creek, and 4.4 mi
upstream from mouth.
DRAINAGE AREA.--142 mi² of which 7.78 mi² probably is
noncontributing.
PERIOD OF RECORD.--Occasional discharge measurements,
water years 1977-80. December 1980 to current year.
REVISIONS HISTORY.--WDR-US-2012: 2011(m).
GAGE.--Water-stage recorder. Datum of gage is 247.87 ft
above NGVD of 1929 (levels by Corps of Engineers) and 247.51 ft
above NAVD of 1988. Prior to Oct. 1, 1991, at site 0.8 mi
downstream at datum 1.56 ft lower.
COOPERATION.--Water-quality samples were collected by
the Monroe County Department of Environmental Services and
analyzed by the Monroe County Environmental Laboratory at
Rochester, NY. Prior to 2003, water-quality samples and
discharge measurements were collected and provided by the
Monroe County Environmental Laboratory at Rochester, N.Y.
REMARKS.--Discharge includes undetermined diversion from
Erie (Barge) Canal. Unpublished water-quality records for prior
years are available in files of Monroe County Department of
Health.
Water Years 2014-20: Records good except those for estimated
daily discharges, which are fair. Water Year 2021: Records good
except those for estimated daily discharges and those above
1,000 ft³/s, which are poor. Water Years 2022-24: Records
fair except those for estimated daily discharges and those
above 1,000 ft³/s, which are poor.
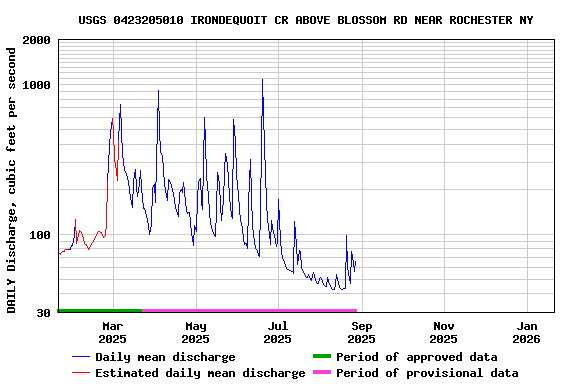
EXTREMES FOR PERIOD OF RECORD.--Maximum discharge, 3,300
ft³/s, Jan. 8, 1998, gage height, 9.95 ft; maximum gage height,
9.97 ft, Oct. 30, 2021; minimum discharge, 25 ft³/s, Sept. 8,
9, 10, 14, 2002, gage height, 2.14 ft.
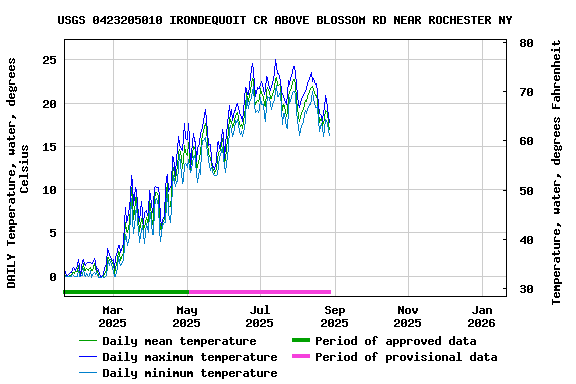
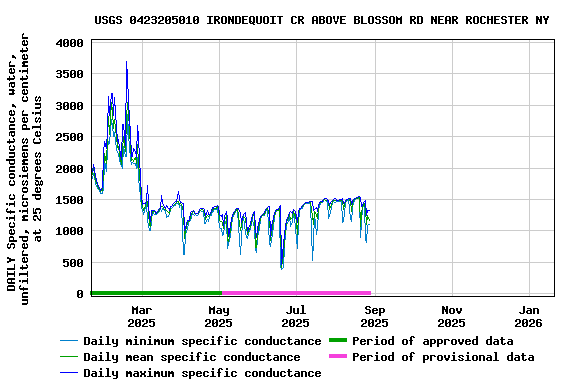
PERIOD OF DAILY RECORD1.--WATER TEMPERATURE:
November 1994 to September 2001 and October 2004 to current
year. SPECIFIC CONDUCTANCE: May 2021 to current year.
INSTRUMENTATION1.--A continuous water-quality
monitor with water temperature and specific conductance
provides 15-minute-interval readings.
EXTREMES FOR PERIOD OF DAILY RECORD1.--WATER
TEMPERATURE: Maximum, 27.0°C, July 5, 6, 1999; minimum, -0.2°C,
on many days during the winter of the 2016, 2017, and 2018
water years. SPECIFIC CONDUCTANCE: Maximum, 3,190 uS/cm at 25
°C, Feb. 5, 2025; minimum, 306 uS/cm at 25 °C, Aug. 25,
2023.
1 Water-Quality Records
 Site Information
 WaterAlert – get an
email or text (SMS) alert based on your chosen threshold.
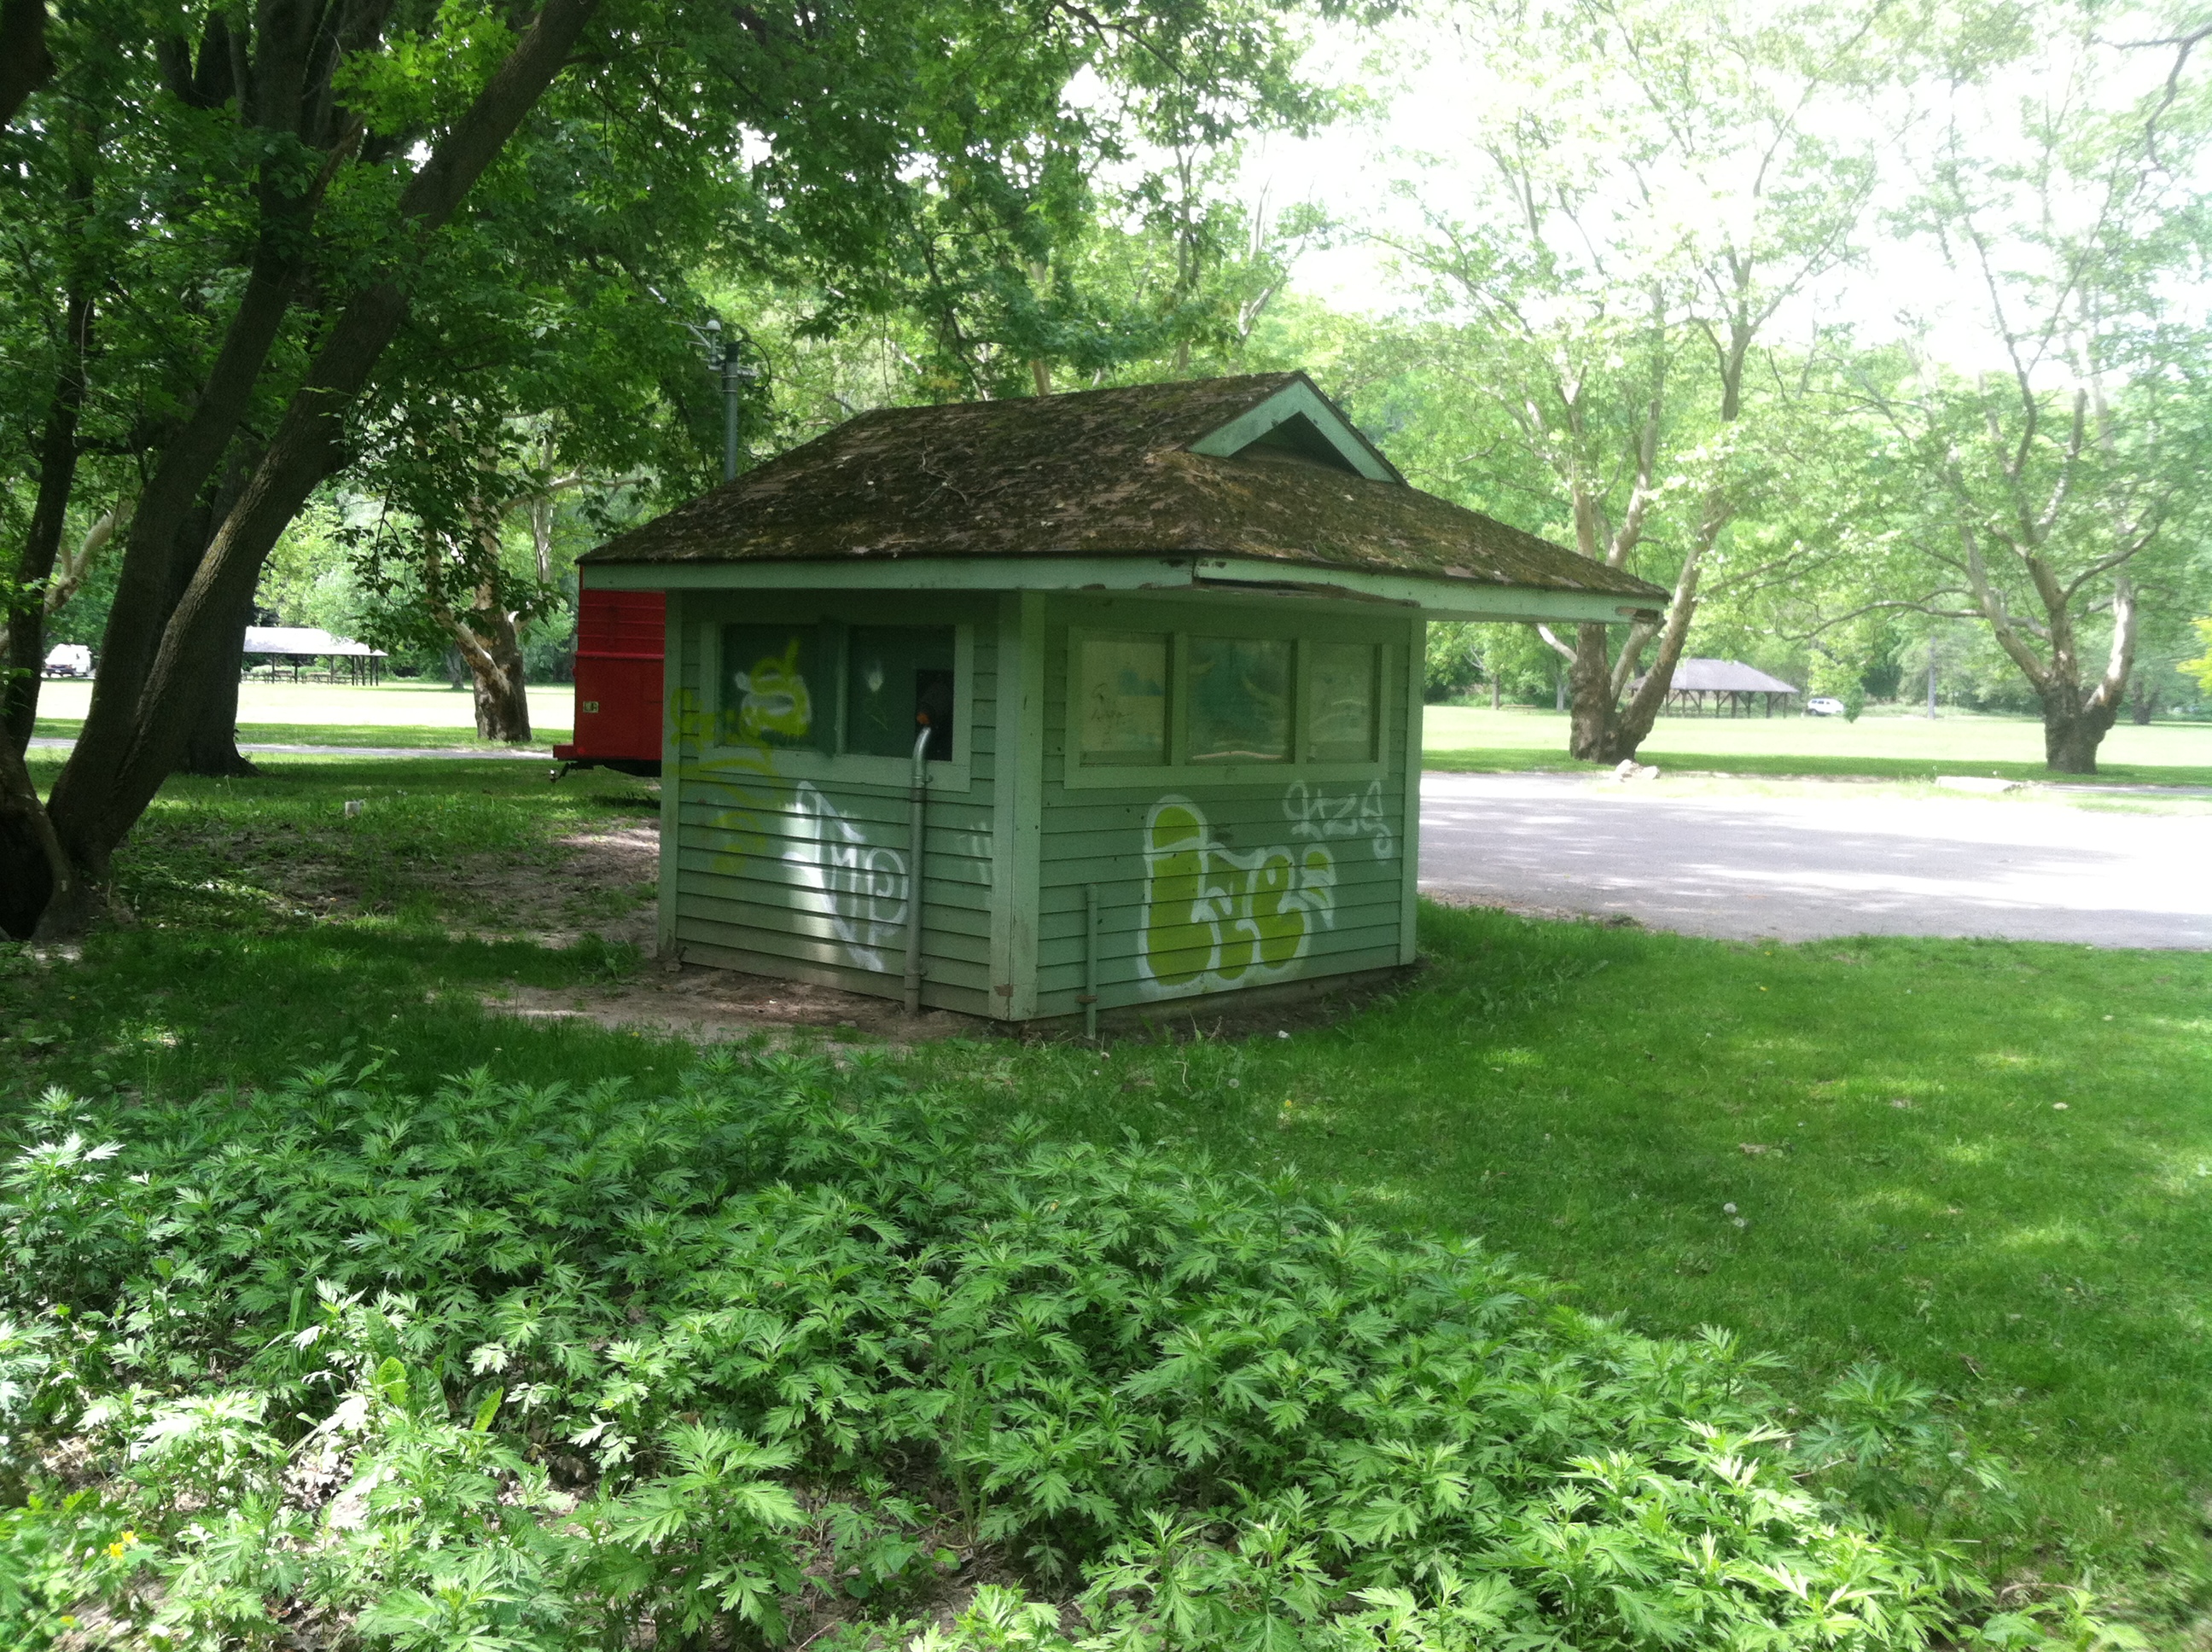
 Station image

