
How Web Flags help the public understand our data
Water data can be masked to help explain gaps in water data availability.
How Web Flags help the public understand our data
USGS Water Data are important to the public and help people to make critical decisions, but conditions in the field are often complicated to convey. Therefore, USGS hydrologic technicians apply web flags to convey gaps in data to the public so users understand unusual values or missing data.
Web flags are displayed graphically on monitoring location pages and can either be kept on data permanently or removed when data are reviewed and corrected. Here are some common web flags and some example reasons for their application. This list is not comprehensive and therefore does not include all possible web flags or all possible causes.
Web Flags Indicate Why No Data are Present
Discontinued
Definition
A station has been permanently or temporarily discontinued.
Example Causes
- A study has ended and data no longer needs to be collected at that site
- Funding has been discontinued
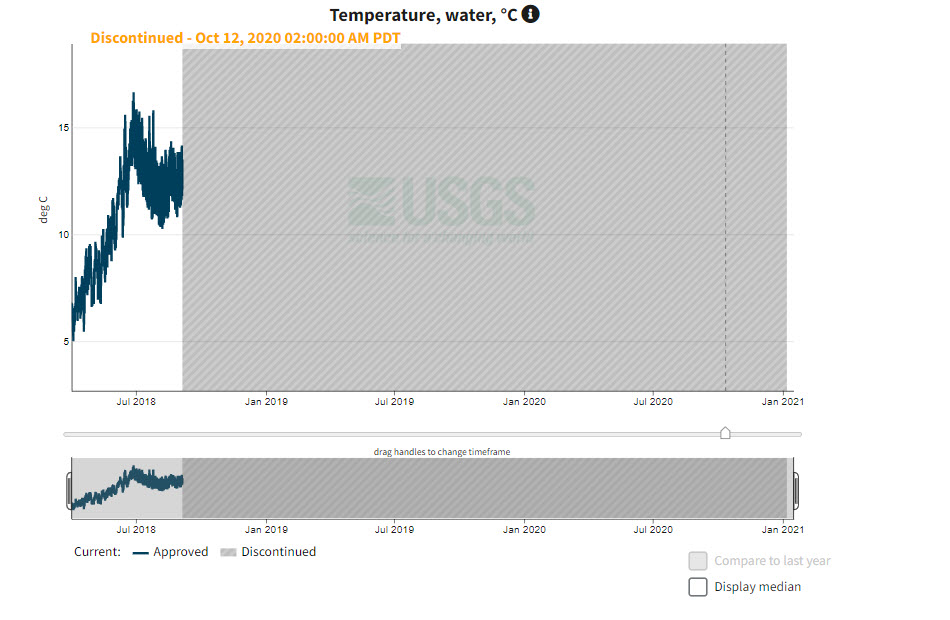
A hydrograph of temperature at site 13343000, where temperature data has been discontinued and is no longer served at this site.
Temporarily Unavailable
Definition
Data are not available and are not being transmitted for a short period of time, which can vary from hours to months, depending on site access.
Example Causes
- Transmission issues with telemetry equipment
- Issues with our data processing software
Seasonal
Definition
One or more types of data are not available because the station is in its off season, but data will be back in a matter of months.
Example Causes
- Weather conditions may damage sensors (e.g., due to ice chunks in the river)
- Accessibility changes that fluctuate with seasonal changes such as
- Lack of water flow
- Limited access to equipment
- Lack of ability to telemeter data
Web Flags Tell Users to be Cautious With Data
Equipment Malfunction
Definition
We suspect or have evidence that there is an equipment malfunction.
Example Causes
- Our monitoring equipment malfunctions, leading to inaccurate data
- Our monitoring equipment has been damaged
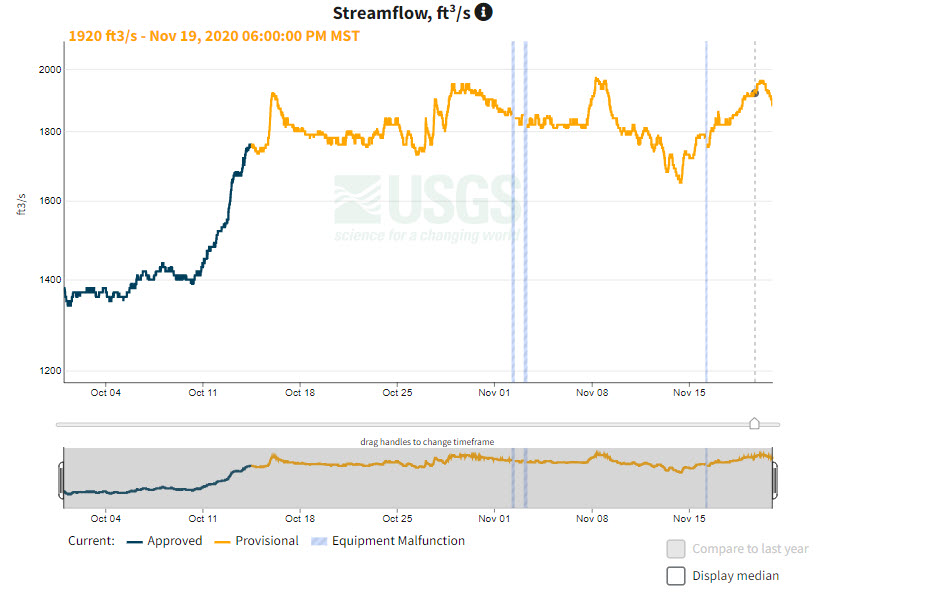
A hydrograph at location 13307000 where web flags were applied during periods of malfunctioning equipment in November 2020.
Backwater
Definition
Water that is backed up as compared with its normal or natural condition of flow. In stream gaging, a rise in stage is produced by a temporary obstruction. The difference between the observed stage and the one indicated by the stage-discharge relation is reported as backwater. Using the “Backwater” web flag allows users to see gage height data, but not discharge data as these data need to be corrected.
Example Causes
- Obstructions, such as beaver dams, weeds, or vegetation
- Ice jam in a stream channel
- Flooding downstream of the stream gage
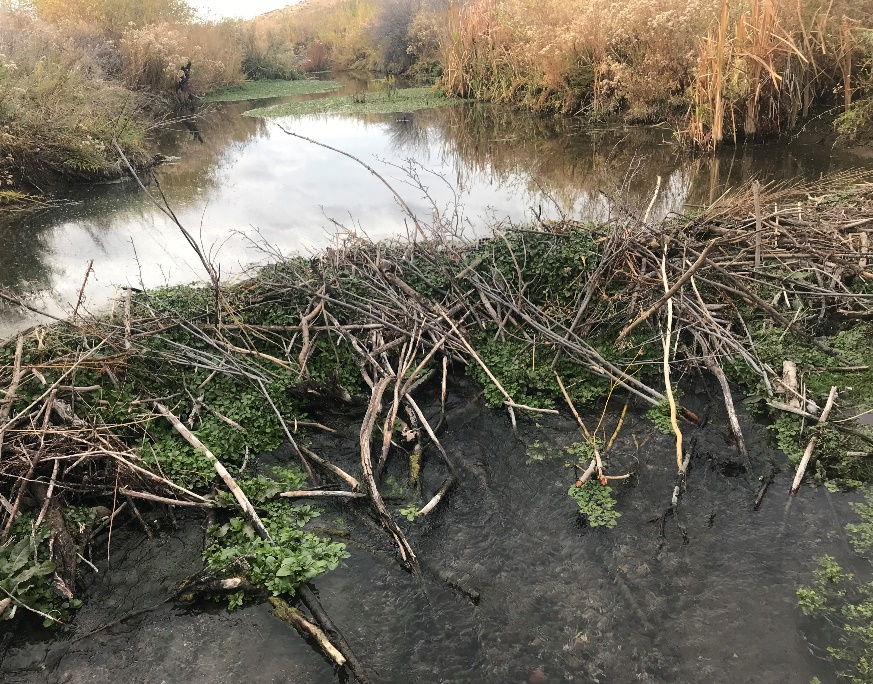
Photo of a stream affected by backwater. Photo credit, USGS-Scott Sylvester
Ice-Affected
Definition
Data are not being accurately transmitted due to the presence of ice.
Example Causes
- In cold climates, streams are commonly affected by ice, which can
- Inaccurately show more or less water than is actually there
- Block sensors
- Create backwater
- Otherwise prevent data from being transmitted accurately
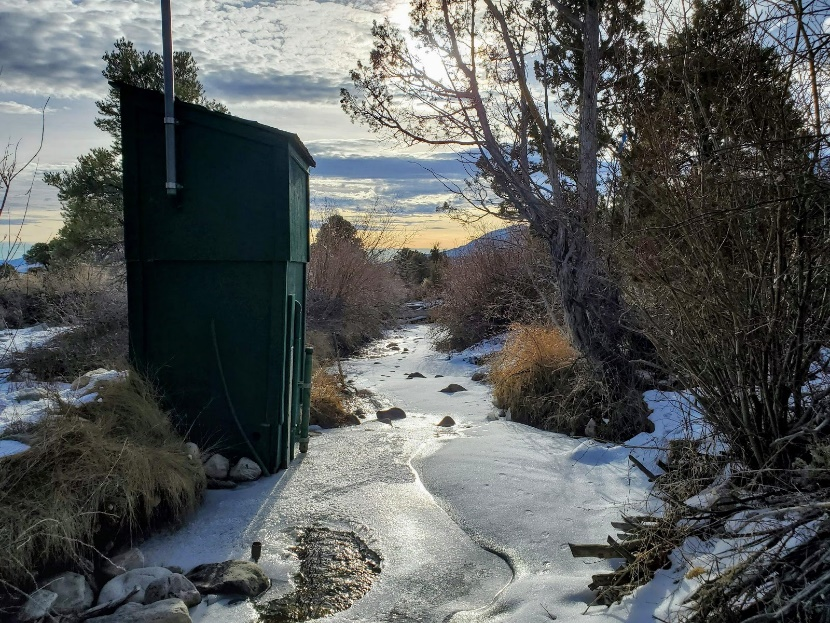
Photo of a stream whose data readings are affected by the presence of ice. This is when the ‘Ice Affected’ web flag would be used. Photo credit USGS-Austin Bove.
Maintenance
Definition
Maintenance is planned and/ or being conducted to stream monitoring equipment by our field hydrologic technicians.
Example Causes
Monitoring equipment
- Is damaged and needs to be repaired
- Requires routine maintenance
- Is currently undergoing maintenance
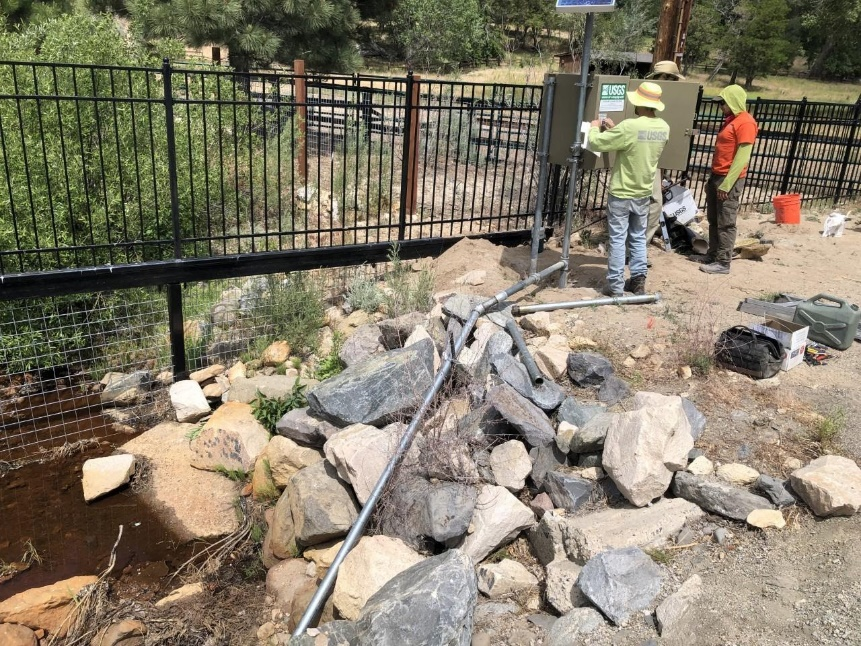
Two USGS staff repair equipment at an active streamgage. No data will be transmitted during this activity and a web flag can be applied to data during this time period. Photo credit: USGS - Cory Rogaczewski.
This is not a comprehensive list of all web flags that may be applied, but these examples show how web flags help us to explain to users what is happening with our data. Users can quickly glance at hydrographs with web flags and understand why data may not be showing up, what current conditions are, and how reliable we believe current data to be. Data transparency is fundamental to our mission at USGS.
Categories:
Related Posts
Modernizing How You Access Water Data | Webinar on Oct 13 | Recording Available
October 1, 2021
Missed the webinar? Watch the recording
The recording of this webinar can be viewed on the USGS website or on the USGS YouTube channel .
Why We Use Gage Height
July 21, 2021
Making Water Data Easier to Understand
On USGS water monitoring location pages, the default parameter that is displayed for streamgage sites is gage height. Other measures like streamflow are still available and easily accessed with just one click. Gage height is the distance (or height) of the water surface above the streamgage datum reference point. Gage datum is a unique reference point to each gage site and is generally located underneath the streambed to accommodate for stream channel changes.
User-Centered Design - WDFN Multi-Location Functionality
August 18, 2025
User-centered design is a process where we focus our designs based on the context and the needs of our users. We involve users throughout our agile and user-centered development process. The core principles of user-centered design are to learn about the users, build for their needs, and refine your designs based on their feedback.
This blog post focuses on how we used the core principles of user-centered design to modernize the Water Data for the Nation (WDFN) multi-location functionality. Learn more about user-centered design in our previous blog.User-Centered Design
June 8, 2022
The USGS Water Resources Mission Area (WMA) is the largest provider of real time and historical water information in the world. A major part of our work on information delivery is to build modern web applications and APIs to make these data publicly available.
Check Status Users
December 29, 2021
Here at WDFN, we employ user-centered design to build better products and reduce risk. This blog is one of a five-part series on users of WDFN: Are You a USGS Water Data User? | Water Data For The Nation Blog .