
Centralized Water Data in WDFN
Water Data for the Nation (WDFN) is being modernized to simplify our data delivery and enable all data collection categories to be found from the same pages and tools. This post will orient you to where to find water data in the modernized WDFN.
What's on this page
Introduction
There have been a lot of changes to how you access USGS water data as we work to modernize data delivery in Water Data for the Nation (WDFN) and decommission NWISWeb. WDFN is no longer organizing data based on discipline specific landing pages (e.g., surface water, groundwater, water quality, and water use). WDFN also no longer provides a dedicated page displaying the data inventory or “summary of all available data” for each monitoring location as these features have been consolidated into modernized webpages. These changes will simplify our data delivery and enable all data collection categories to be found from the same pages and tools. This post will orient you to where to find the water data you need.
Centralized data in WDFN
The Monitoring Location Pages (MLPs) serve as the central entry point for all water data collected at a location. In WDFN, all data collection categories are organized on the MLP. This is a change from NWISWeb where data collection categories were spread out across multiple web pages.
Below the graph on the MLP, you can view the data available at that location. The data available may include continuous data, daily data, field measurements, discrete sample data, statistics derived from daily data, and location details and information. Continuous data have been delivered on the MLP for several years, and we have recently added delivery of the additional data collection categories of daily, field measurements, and discrete sample data. Location metadata has also been delivered on the MLP for several years, under “Location details and information.” Learn more about the data collection categories delivered in WDFN.
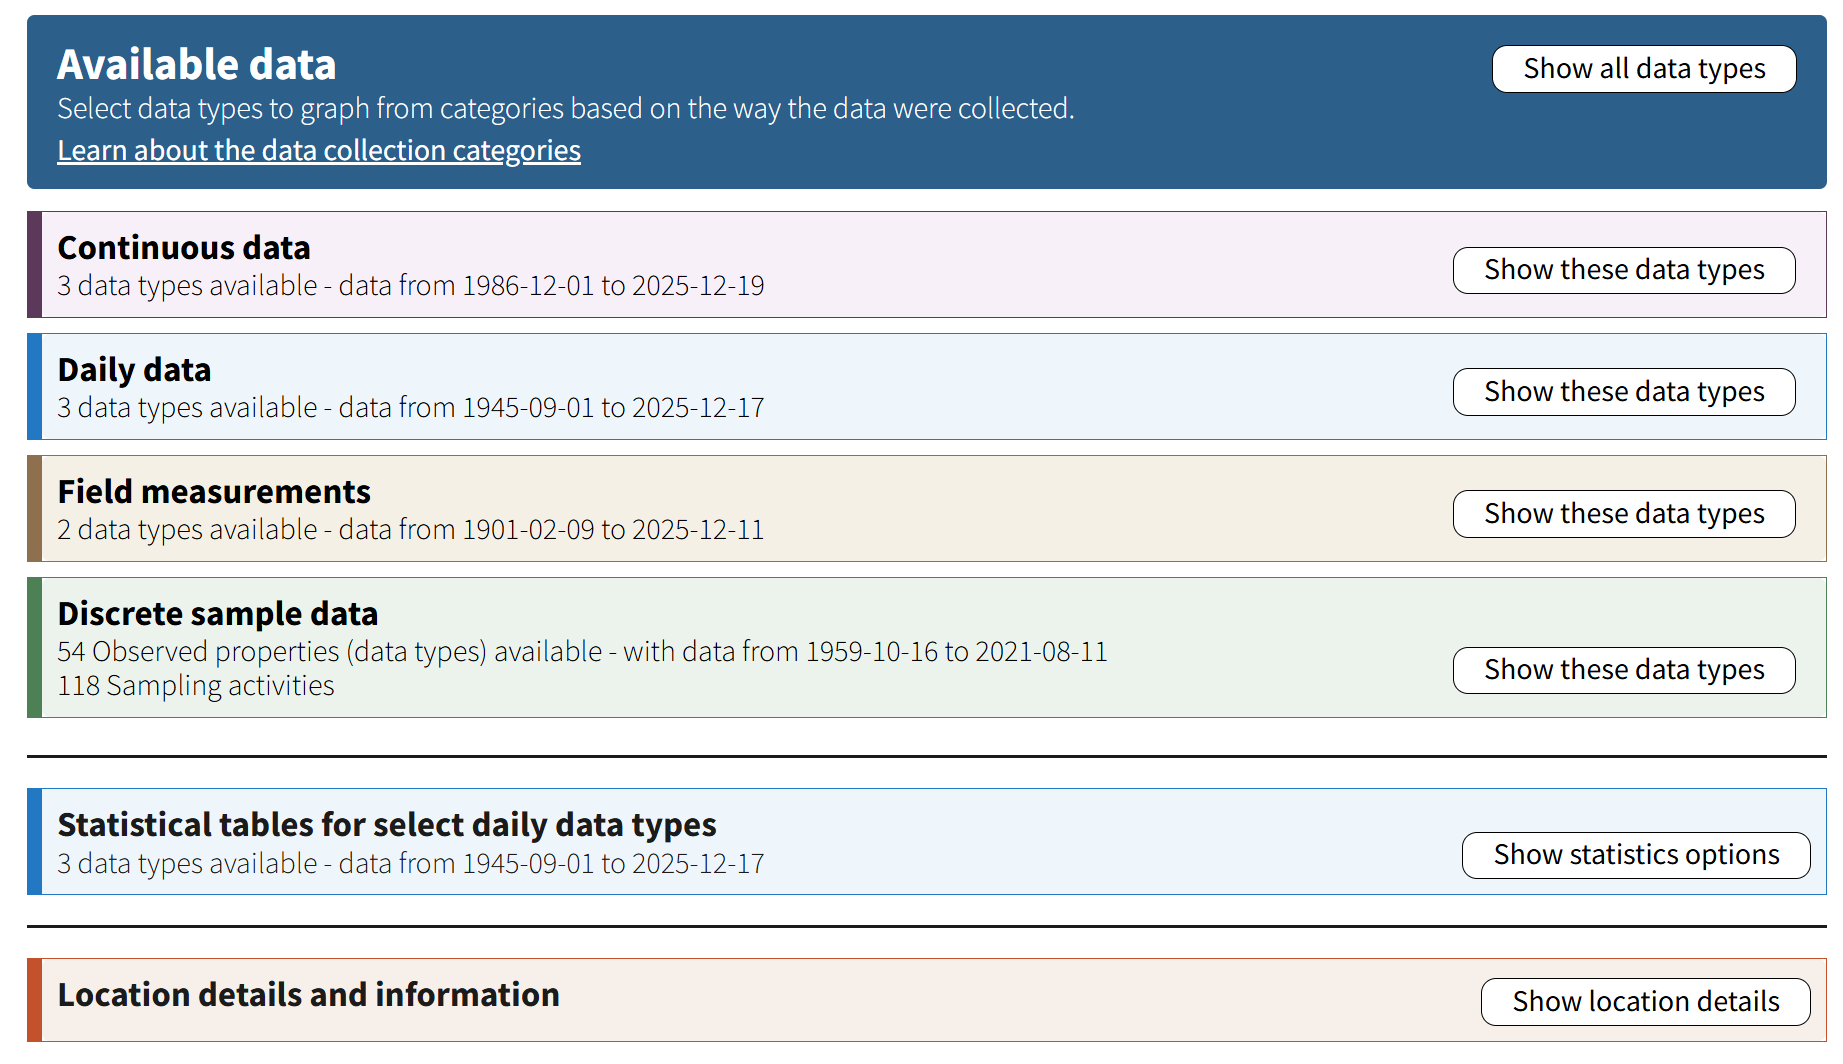
The Available data section of the Monitoring Location Page (MLP) shows all the data collected at the location.
You can graph all data types listed under continuous data, daily data, and field measurements. Once you select which data to graph, you can change time span, view related graphs, download data, and view data records with the controls below the graph. The data available for download or as tabular data reflect the data type and time span displayed in the graph.
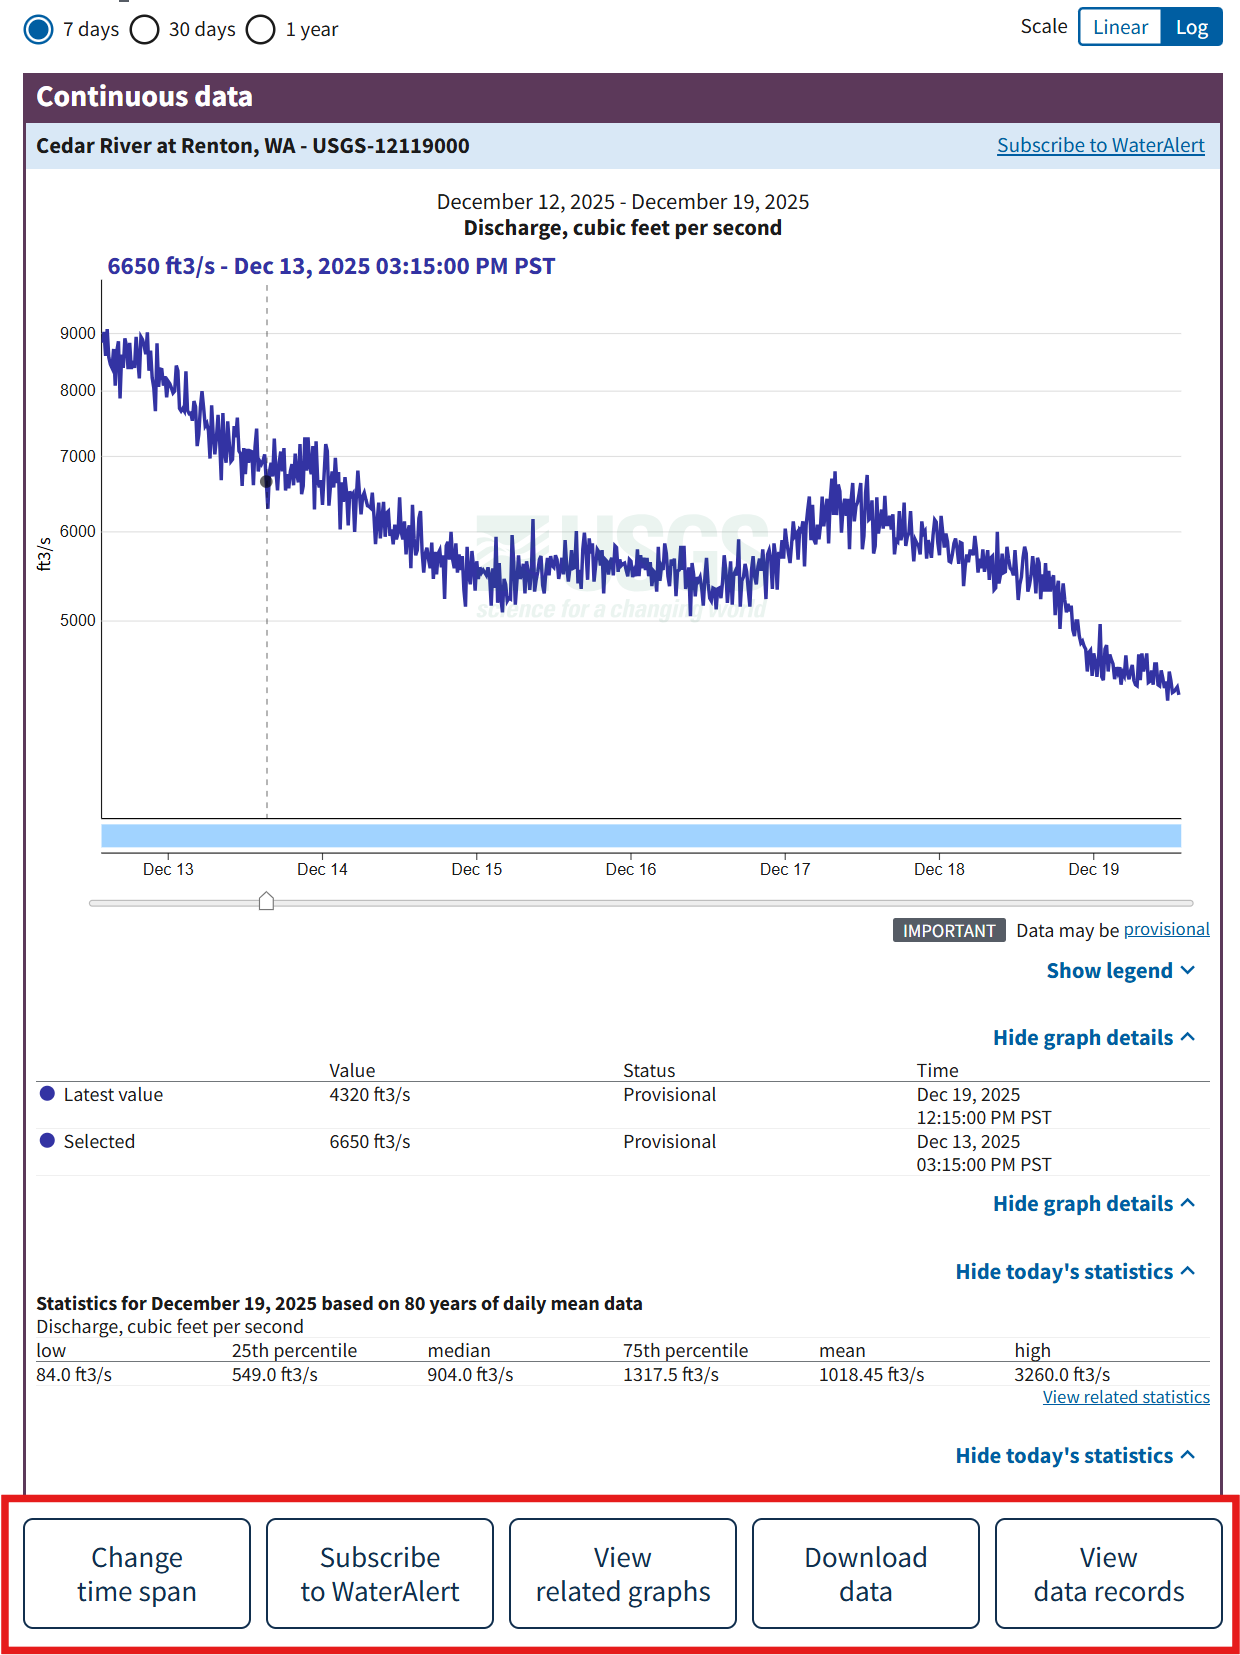
Action buttons under the graph allow you to set custom time spans, download data that is displayed on the graph, and view the data records in a table that are displayed on the graph.
The information available in the buttons below the graph change when you select different data collections.
Visit the blog posts linked below to learn more about the new features available on the MLP and delivery of these data on other pages in WDFN:
Discovering water data in WDFN
Now that all USGS water data are accessible from the MLP, we want to introduce you to the different ways to find a monitoring location and the water data collected there that interests you. Starting at WDFN Home you can explore the different tools and pages available. Read the WDFN Home blog post to learn more about what you can find on the new homepage for USGS water data.
WDFN has several map pages to help you find a monitoring location of interest to you:
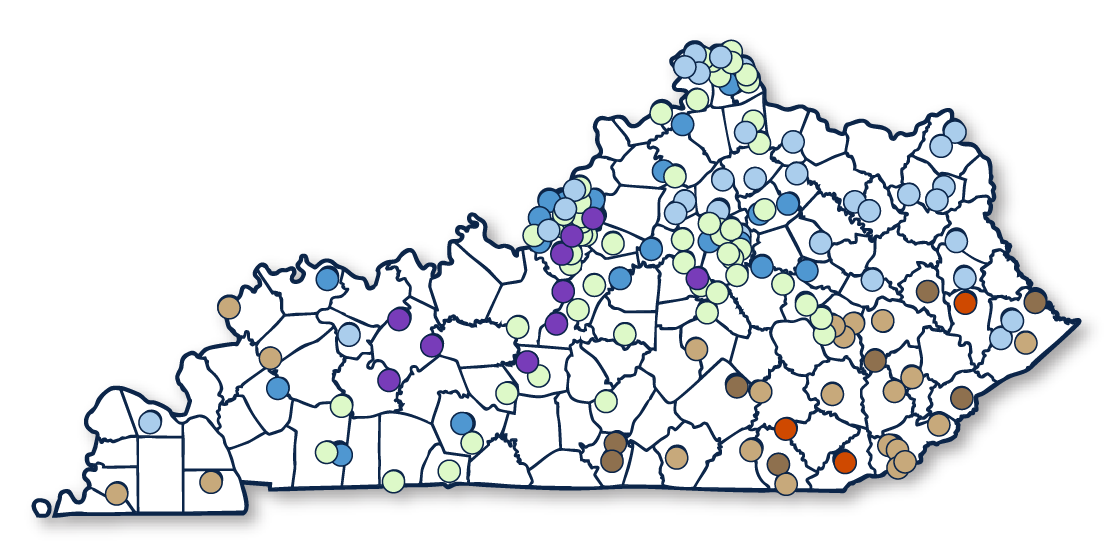
The State Page provides a summary of the latest continuous data collected at monitoring locations in your state. Click on locations in the map to see more information and visit the MLP.
Read the blog post to learn about more features of the State Pages.
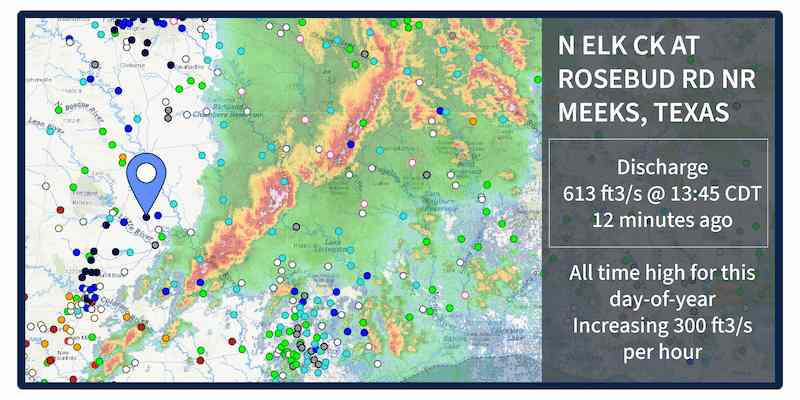
The National Water Dashboard shows the latest continuous data for monitoring locations across the country, along with latest weather conditions to understand rapidly changing water conditions.
The Explore USGS Water Data page can be used to find monitoring locations that have collected continuous data or discrete sample data in the 135-year history of USGS water data. Filter locations to find current or historic data collected across all types of water data.
Read the blog post to learn about more features of Explore USGS Water Data
Decommission of NWISWeb
All types of water data are available throughout WDFN on graphs, in tables, to download, and accessible with the new API. Therefore, we have decommissioned the legacy NWISWeb landing pages that helped you discover these data and these pages are no longer accessible. In Decommission Campaign 2, the legacy NWISWeb URLs will be redirected to modernized WDFN webpages when possible, or to relevant resources to help you find the data you were looking for on new WDFN webpages.
Want to know if your webpage will be affected? Look at the URL in your browser window (for example, waterdata.usgs.gov/ca/nwis/gw). Decommission impacts the landing pages located at https://waterdata.usgs.gov URLs that end with:
- /gw
- /sw
- /qw
- /si
- /notes
- /inventory
Learn more about the decommission of NWISWeb and stay up-to-date with our decommission timing and progress by following along with the WDFN Blog .
We are here to help
We understand that change is hard, and some of these changes might feel sudden. We’re here to help. We have staff ready to help you make the transition to using WDFN webpages should you need it. Please reach out to us at gs-w_waterdata_support@usgs.gov with any questions. You can get regular updates about the modernization and decommission effort sent to your inbox by subscribing to the Water Data for the Nation Newsletter
The WDFN websites and services advance the way we deliver water data, and we are focused on continual improvement. Our team uses user-centered design processes to determine what to prioritize next. Let us know how the WDFN pages are working for you by emailing gs-w_waterdata_support@usgs.gov .
Related Posts
Daily data in Water Data for the Nation
November 21, 2025
There have been a lot of changes to how you access USGS water data as we work to modernize data delivery in WDFN and decommission NWISWeb. As we centralize and re-organize data delivery in WDFN, we have recently set out to describe different types of water data according to data collection categories . We started with re-organizing and expanding the data collection categories that are delivered on the Monitoring Location Page and are now working to deliver additional data collection categories on other WDFN pages as well. This blog is part of a series to help orient you to where you can find different types of data in WDFN pages and services. In this post, we want to focus on how you can access daily data in WDFN.
Decommissioning Legacy gwlevels and SensorThings APIs – Fall 2025
September 23, 2025
Background
For over 15 years, the USGS has provided machine-readable and automated access to water data via the WaterServices family of application programming interfaces (APIs), which are hosted at https://waterservices.usgs.gov/ . These APIs underpin all other USGS web delivery products – including products such as the National Water Dashboard and Water Data for the Nation (WDFN) – and have been incredibly effective at delivering water data to the public. Between October 2024 and March 2025 alone, these legacy APIs have handled more than 1.6 billion requests from almost 3.5 million distinct IP addresses.
New Feature - Field Measurements
September 23, 2025
We are excited to announce a new feature on Monitoring Location pages that provide field measurements, which are physically measured values collected during a field visit to a monitoring location.
Modernization of Statistical Delivery and WaterWatch Decommission
June 10, 2025
USGS is modernizing how statistical information is delivered through a suite of new features and products. These are replacing WaterWatch , which offered unique statistics delivery that differentiated it from the core data delivery through legacy NWISWeb. WaterWatch and Water Quality Watch are set to be decommissioned by the end of 2025 as new products become available. This blog details where you can find the statistics previously offered on WaterWatch.
New Feature - All Graphs
June 6, 2023
We are excited to announce that a new feature is now available to Monitoring Location Pages as part of our modernization efforts. The All Graphs page will show a series of individual graphs of all current sensor data collected at a single location. This page has been highly requested by users who want to see all the graphs on a single page without any clicking—just like the functionality on the legacy Current Conditions page, but with exciting new features and improved usability on mobile devices.