
Modernization and decommission of statistics delivery for USGS Water Data for the Nation
Official websites use .gov
A .gov website belongs to an official government organization in the
United States.
Secure .gov websites use HTTPS
A lock (
) or https:// means you’ve safely connected to the .gov website. Share
sensitive information only on official, secure websites.
Modernization and decommission of statistics delivery for USGS Water Data for the Nation
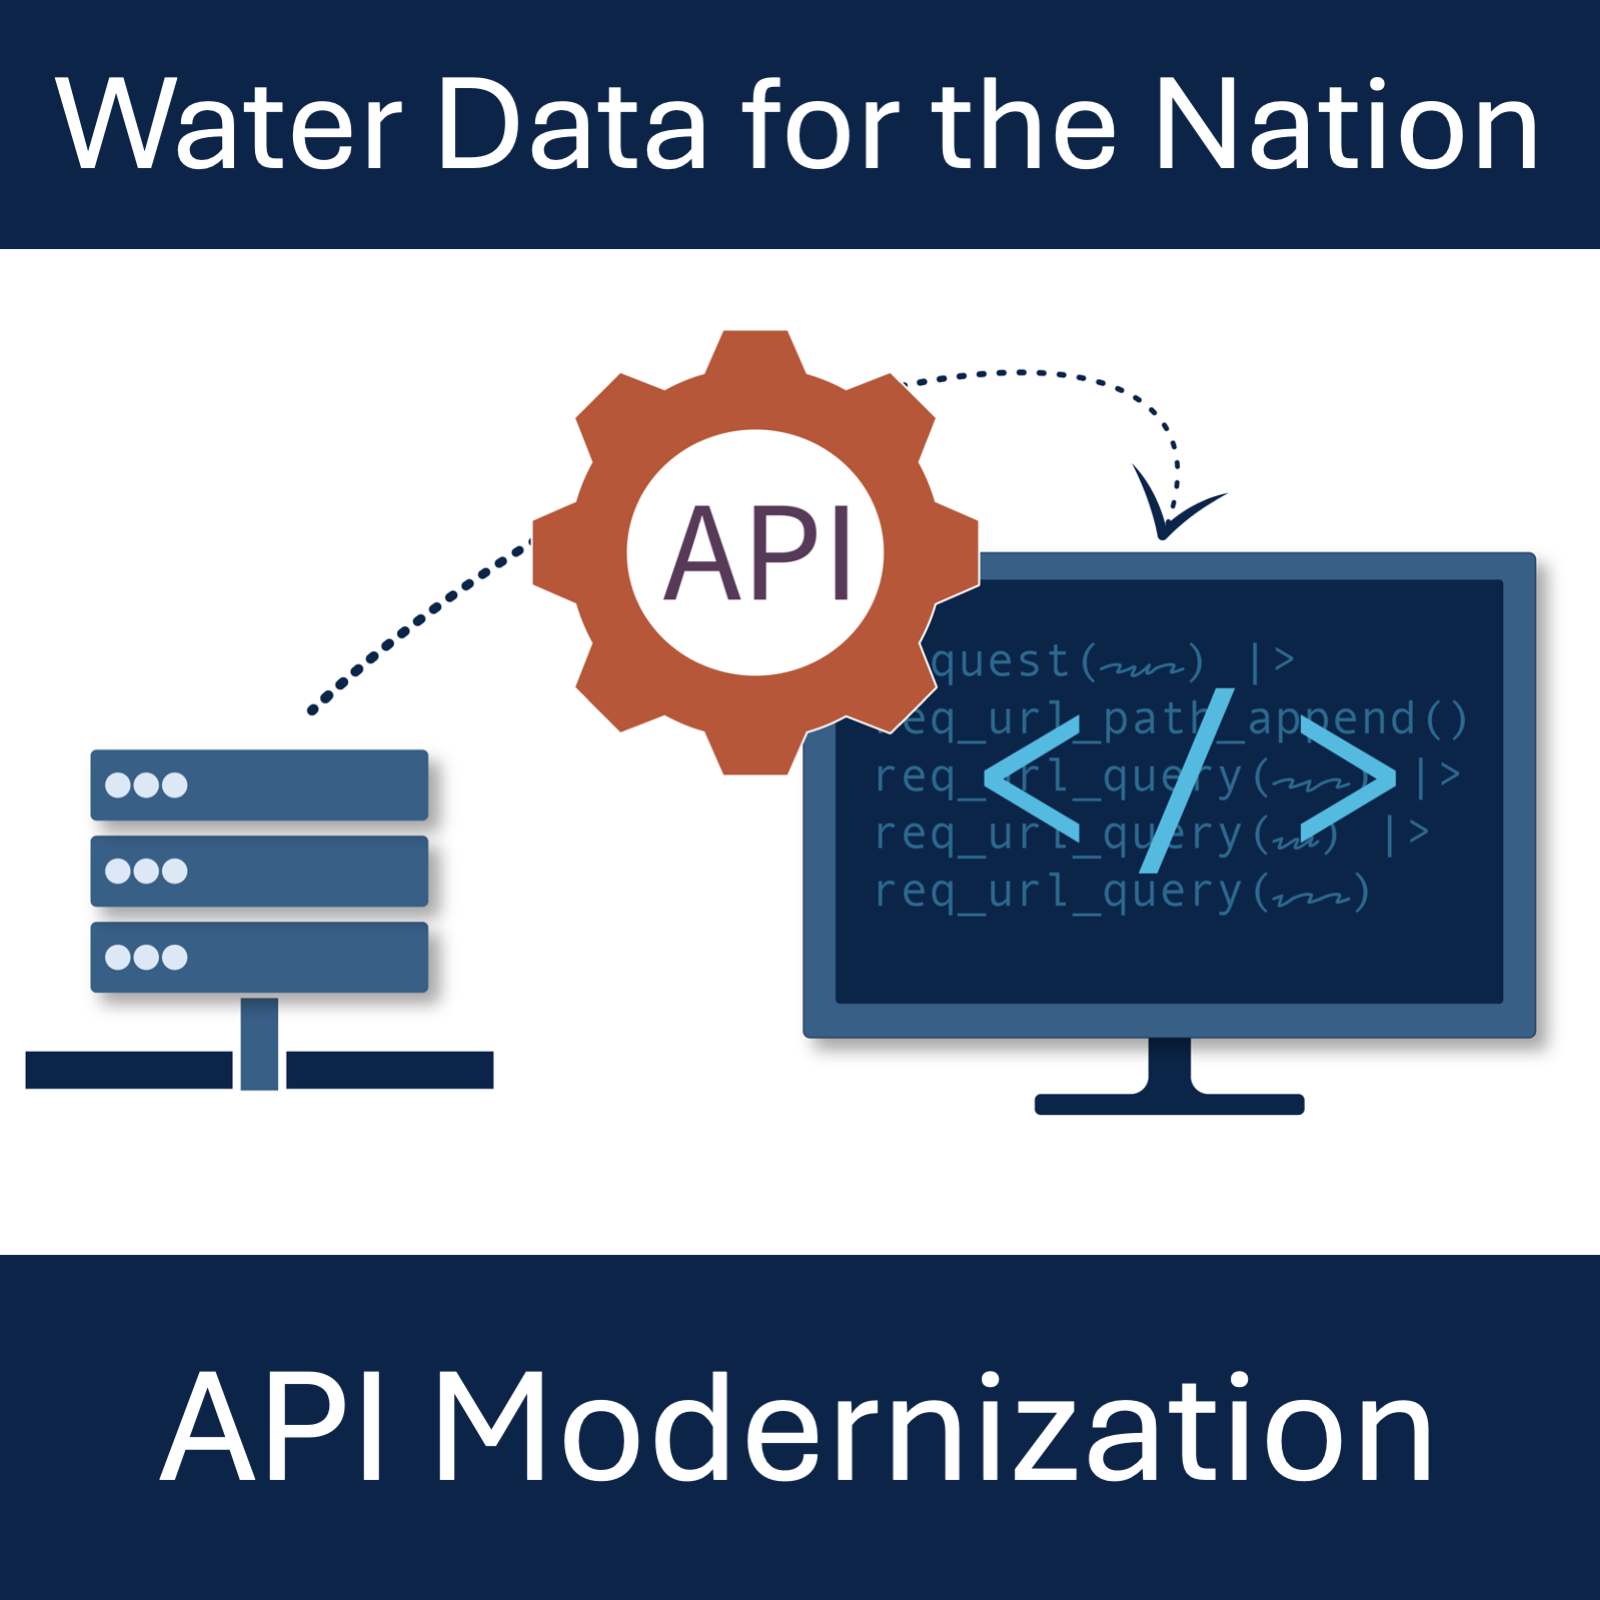
What to expect from modernized replacements to the WaterServices family of APIs.
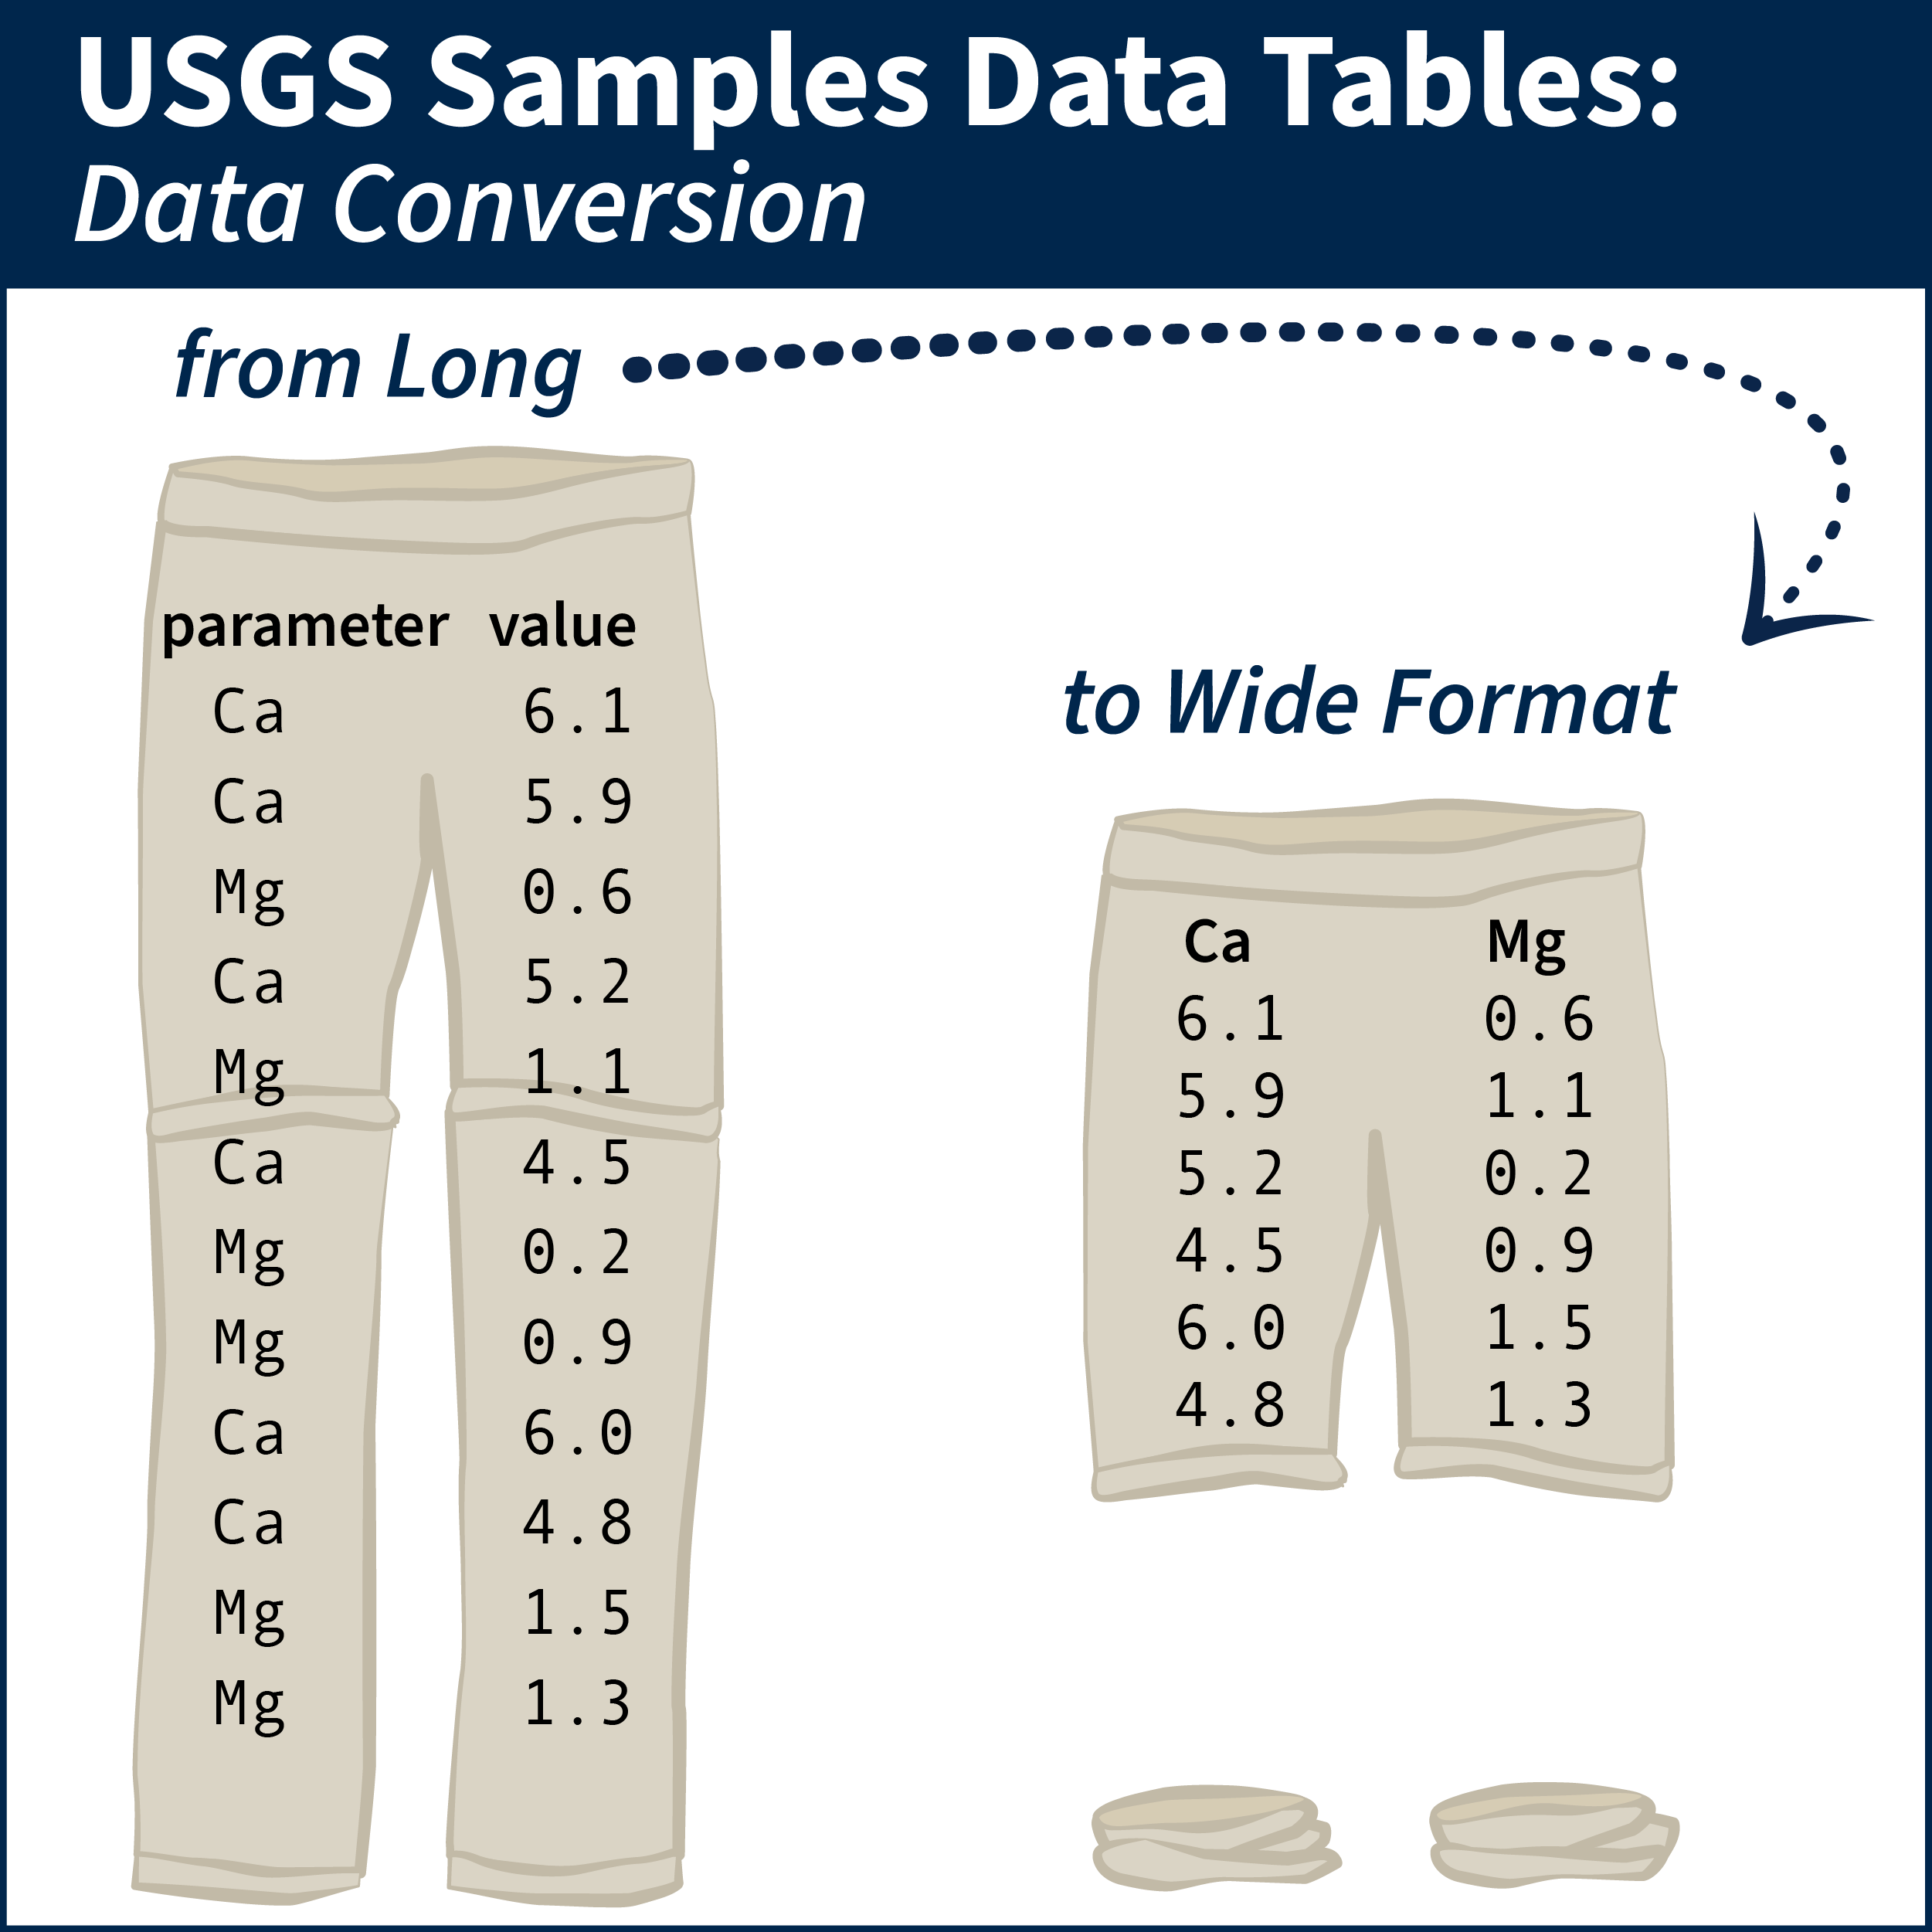
Tips and example R scripts for converting long-formatted data into wide tabular format
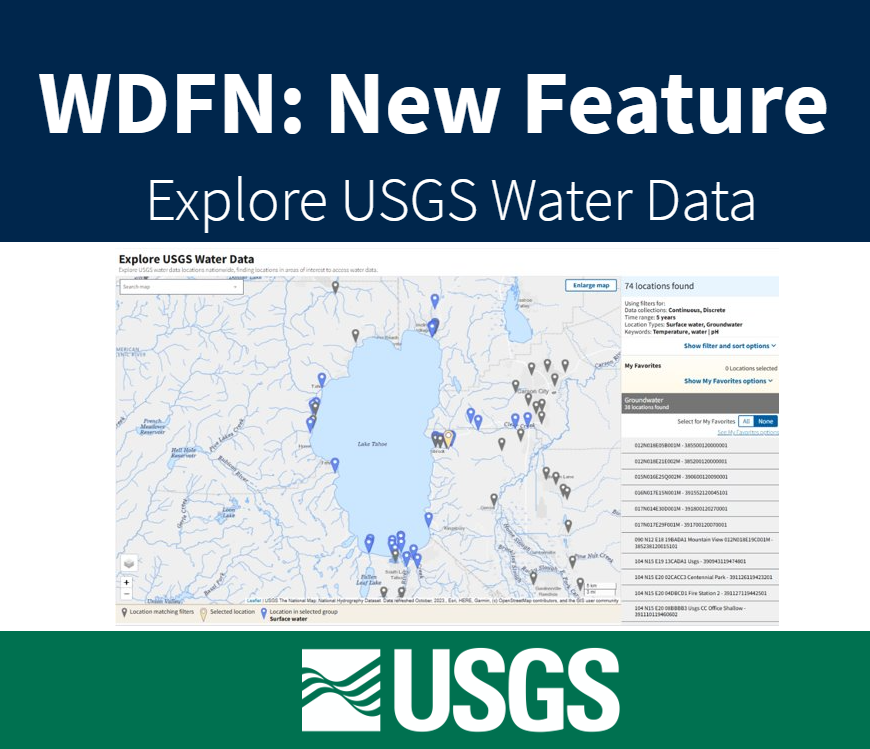
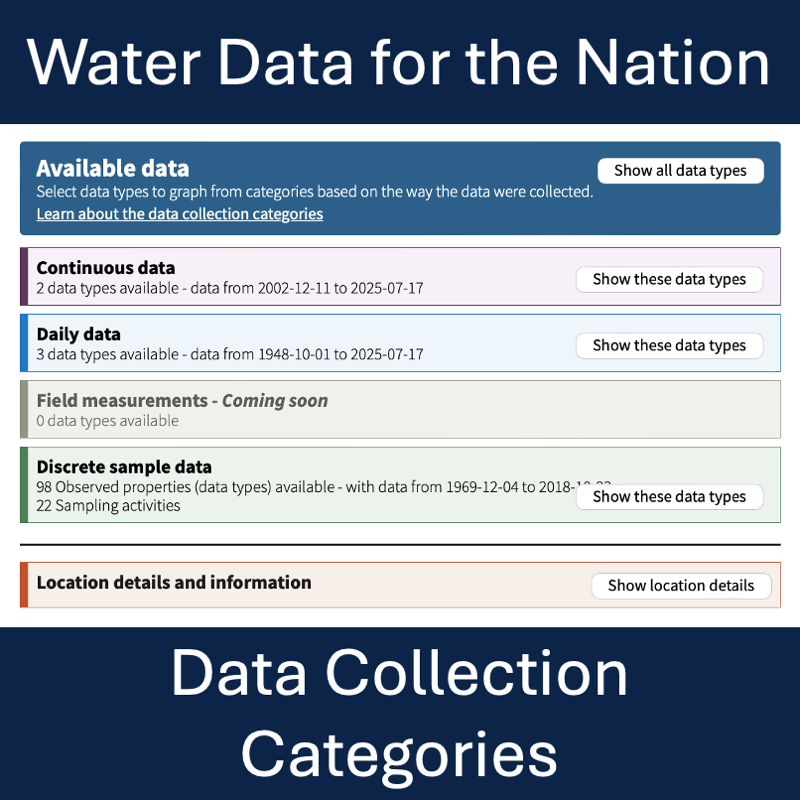
This new feature is used to search and filter through data by locations and data collection categories in WDFN.
In 2024, we asked our users for feedback. This is what we found.
We’ve made changes to the Monitoring Location Page (MLP) to make all kinds of water data accessible from the same place in WDFN.
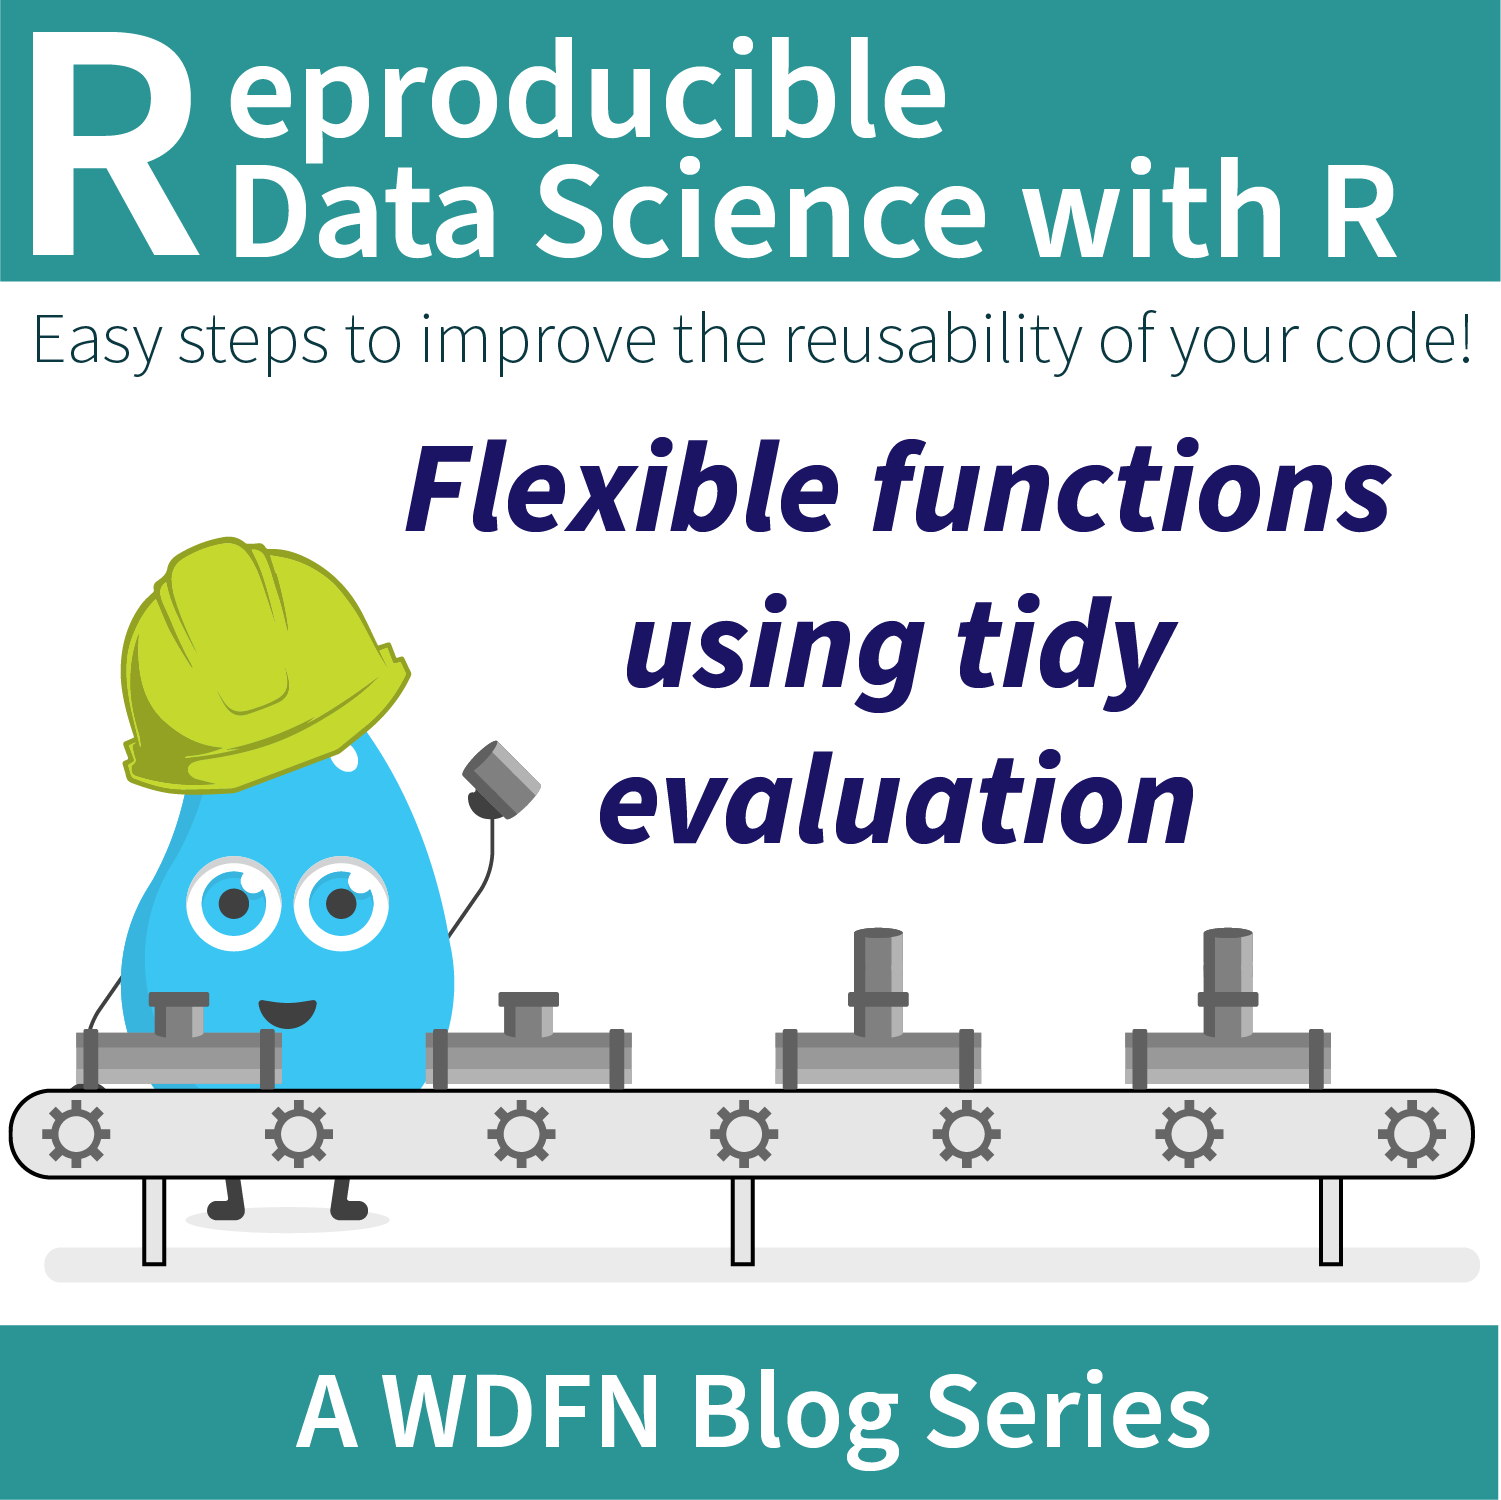
Improve your functions with helpful dataframe evaluation patterns.

hyswap is an open-source Python package that is designed to enable cooperators, stakeholders and the public to calculate summary hydrologic statistics and create maps, tables and visualizations for critical decision-making. Access the package at https://github.com/DOI-USGS/hyswap .
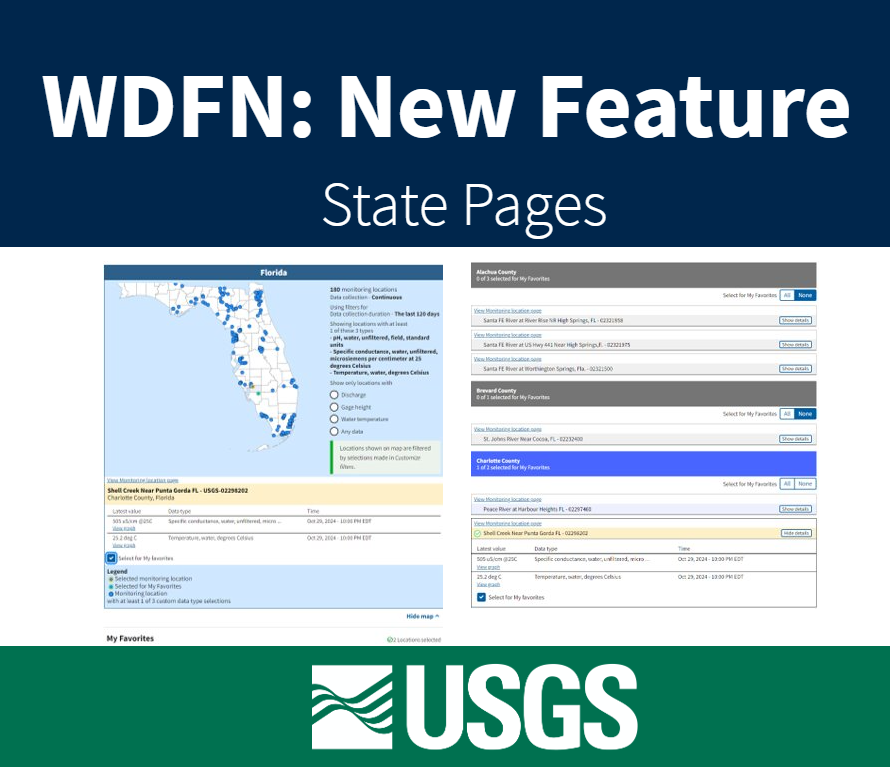
Feature to see current water conditions from all monitoring locations in a state that collect continuous data.
This blog describes a mapping file available to users to ease the transition to the WQX version 3.0 format. The spreadsheet provides high-level mapping of data fields in the legacy NWIS format to WQX fields.