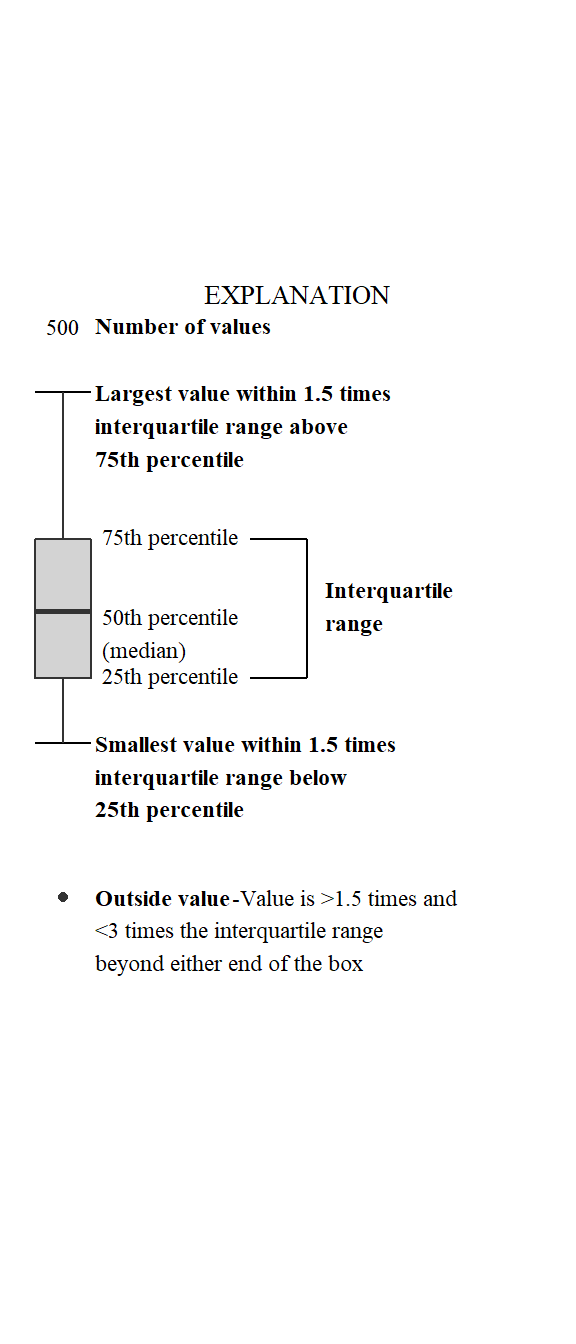
Identifying boxplot limits and styles in ggplot2.
Official websites use .gov
A .gov website belongs to an official government organization in the
United States.
Secure .gov websites use HTTPS
A lock (
) or https:// means you’ve safely connected to the .gov website. Share
sensitive information only on official, secure websites.
Identifying boxplot limits and styles in ggplot2.
Resources for plotting, plus short examples for using ggplot2 for common use-cases and adding USGS style.
More advanced data munging techniques in R that were not covered in the Intro to R class.
Brief introduction to the series of posts about next steps after learning basic R, plus some tips on best practices for scripting in R.