
25 years of Water Data on the Web
A look back at the beginnings of presenting water data on the web, and a peak at what the USGS is going to be doing in the next 25 years.
A few weeks ago, on February 14, 2020, the USGS celebrated the 25th anniversary of a historical milestone, the first public delivery of near real-time water information to over the internet. Prior to February 14, 1995, for 100 years virtually all USGS water data was delivered through paper reports or direct requests to USGS offices, was available primarily as daily statistics (e.g. daily mean discharge), and only after extensive data validation and review – usually a year or more after the date of collection. The transition to our current system of robust delivery of almost all instantaneous data in near real-time and on-line access to our entire historical data holdings did not happen overnight. The initial system, then called rt_www, started with only a handful of sites in Montana delivering a few days of recent streamflow data. It took years of IT development and policy and workflow changes to get to where we are today. It is questionable whether the small group of Montana Water Science Center developers of that initial system knew the full power of what they unleashed, but it is now hard to imagine water science and water resources management in the United States without what we now refer to as Water Data for the Nation
. Without invalidating any of the historical water data uses and users, it vastly expanded the range of both for the betterment of all.
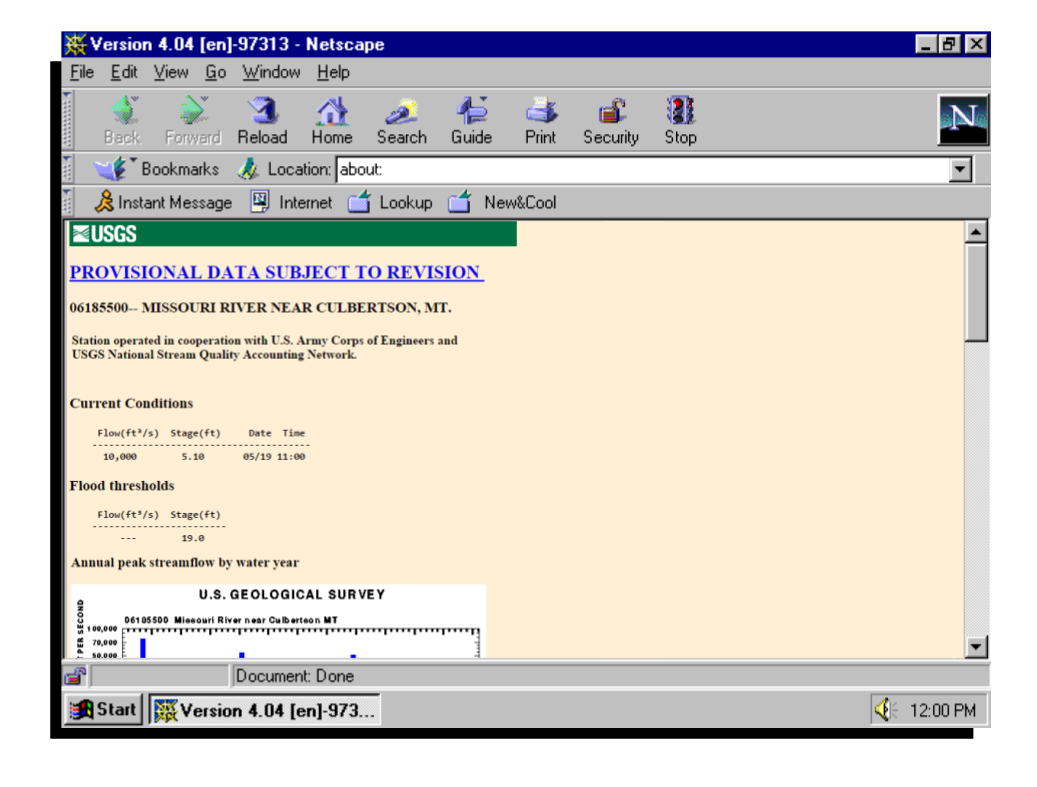
A screenshot of one of the original sites, on Water Data for the Nation, Missouri River near Culbertson MT
A few months ago, on December 18, 2019, another milestone in USGS information delivery was reached that is likely to have similar positive repercussions for both the USGS and the nation in the years ahead - the release of a new water availability mapper
. While only a concept prototype, for the first time the USGS is delivering a daily product that integrates our active monitoring with continuous modeling. Just as rt_www started the process of freeing us from data delivery latency, so the release of the new mapper has started the process of freeing us from reporting water information only where we are doing active monitoring. Rather than reporting on a few thousand sites nationally, we can now look to report on 100,000 or more. Just as the release of rt_www expanded historical users and uses without changing them, so the release of new modeled products will only further extend the range of what is possible. As with rt_www, it will take many steps over years to fully realize our plans for more types of data, more informative delivery products, and more robust data access, and there are no doubt good ideas we have not thought of yet, but we’re very excited by the first small step and look forward to the coming efforts.
The National Integrated Water Availability Assessments concept map compares current natural water storage to daily historical values. This animation shows the effects of a number of different events on natural water storage in November of 2019.
Categories:
Related Posts
WaterServices APIs will be decommissioned early 2027
January 7, 2026
We have released modernized Water Data APIs which will supersede the WaterServices family of APIs. WaterServices will be decommissioned in the first quarter of 2027. We will have more information about the decommission process, which may include intentional service degradation and blackouts, in the second half of 2026. We will not begin any intentional degradation of these services before August 2026.
Metadata in Water Data for the Nation
December 29, 2025
Introduction
Metadata are crucial to interpreting and understanding USGS water data. Metadata are data that provides information about other data. They provide important context to the water data you are viewing on WDFN pages or downloading from USGS Water Data APIs . USGS water data metadata includes codes and abbreviations, such as parameter codes, method codes, and observed properties.
Centralized Water Data in WDFN
December 23, 2025
Introduction
There have been a lot of changes to how you access USGS water data as we work to modernize data delivery in Water Data for the Nation (WDFN) and decommission NWISWeb. WDFN is no longer organizing data based on discipline specific landing pages (e.g., surface water, groundwater, water quality, and water use). WDFN also no longer provides a dedicated page displaying the data inventory or “summary of all available data” for each monitoring location as these features have been consolidated into modernized webpages. These changes will simplify our data delivery and enable all data collection categories to be found from the same pages and tools. This post will orient you to where to find the water data you need.
Daily data in Water Data for the Nation
November 21, 2025
There have been a lot of changes to how you access USGS water data as we work to modernize data delivery in WDFN and decommission NWISWeb. As we centralize and re-organize data delivery in WDFN, we have recently set out to describe different types of water data according to data collection categories . We started with re-organizing and expanding the data collection categories that are delivered on the Monitoring Location Page and are now working to deliver additional data collection categories on other WDFN pages as well. This blog is part of a series to help orient you to where you can find different types of data in WDFN pages and services. In this post, we want to focus on how you can access daily data in WDFN.
NWISWeb Decommission Campaign 2
November 21, 2025
This blog will share information on NWISWeb Decommission Campaign 2, the second in a set of three campaigns to decommission legacy NWISWeb pages currently hosted at https://waterdata.usgs.gov . Campaign 2 is expected to be ongoing from November 2025 through February 2026.